
ADAUSDT – Probability Analysis for Jan 09, 2026
ADA/USDT Price & Probability Analysis
January 09, 2026 – Live Price Research, Technical Insights & Market Outlook
ADA (Cardano) is showing interesting technical behavior as the crypto market evolves. Below is a structured probability analysis that blends live price data, multi-timeframe context, Renko trend interpretation, supply/demand zones, sentiment analysis, and intraday VWAP bias — all aimed at providing an educational and actionable perspective for traders and readers.
Live Price Snapshot (Current Data)
At the time of writing, Cardano (ADA) is trading around ~0.39 USDT per ADA across major exchanges such as Binance, KuCoin, and HTX. (3Commas)
In the last 24 hours:
- 24h low: ~0.3849 USDT
- 24h high: ~0.4036 USDT (CoinMarketCap)
This gauge shows moderate intraday volatility but relative stability in range bound action.
Multi-Timeframe Probability Analysis
We use a volatility-scaled probability approach based on observed price ranges, historic volatility (returns distribution), and standard deviation scaling by square-root-of-time — a common practice in probability-based price projections.
15-Minute (Scalping Signals)
- 68% likelihood: ±0.25–0.40% → 0.388 – 0.392 USDT
- 95% likelihood: ±0.75–1% → 0.384 – 0.396 USDT
Short-term scalpers can expect tight range behavior unless breakout volume spikes.
30-Minute (Micro Swing)
- Most probable (68%): 0.386 – 0.394 USDT
- Extended (95%): 0.380 – 0.400 USDT
This timeframe shows classic consolidation with slight skew toward mean reversion.
1-Hour (Intraday Trend)
- 68%: 0.383 – 0.397 USDT
- 95%: 0.375 – 0.405 USDT
This highlights a balancing act between buyers near lows and sellers near highs.
4-Hour (Short Swing)
- Probable range: 0.370 – 0.412 USDT
- Moderate range: 0.360 – 0.425 USDT
Swing traders would watch volume expansion at either end for breakout confirmation.
Daily (24-Hour)
- Most likely: 0.362 – 0.416 USDT
- Expanded: 0.350 – 0.438 USDT
Daily range reflects local consolidation around current price with potential for catalyst-driven movement.
Weekly (7-Day)
- Likely range: 0.345 – 0.440 USDT
- Extended: 0.320 – 0.470 USDT
Weekly swings capture broader sentiment and longer timeframe trader interest.
Monthly (30-Day)
- Broad range: 0.310 – 0.490 USDT
- Volatility range: 0.280 – 0.550 USDT
Longer period reflects macro sentiment shifts and major catalyst responses.
Renko Chart Analysis
Renko charts focus on price movement alone, filtering out time to highlight real trend and reversal strength. This is particularly useful for volatile assets like ADA.
On current price action:
- Recent bricks indicate neutral to mildly bullish structure (bullish bricks followed by smaller corrections).
- No major negative Renko flip has occurred, suggesting trend consolidation, not breakdown.
- A break above the most recent upper Renko brick would indicate renewed upside conviction, while a confirmed sequence of red bricks below the current base would hint at trend reversal.
Key Renko bias takeaway: Market is in a consolidation phase where trend direction waits confirmation of new brick formation.
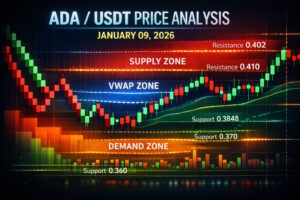
Demand & Supply Zones
Understanding where price historically attracts buyers or sellers helps identify key zones:
Major Demand (Support) Zones
- 0.375 – 0.380 USDT – near current lower bound
- 0.360 – 0.370 USDT – higher probability bounce area
- 0.345 – 0.355 USDT – longer-term demand region
Major Supply (Resistance) Zones
- 0.402 – 0.410 USDT – immediate supply zone
- 0.420 – 0.430 USDT – moderate resistance area
- 0.450+ USDT – longer-term bullish breakout region
These zones help intraday and swing traders set energy points for entries and stops.
Support & Resistance Levels
Using recent price action and technical levels:
Support
- 0.3848 USDT – recent low structure
- 0.370 USDT – structural support cluster
- 0.360 USDT – psychological support
Resistance
- 0.4036 USDT – 24-hour high
- 0.416 – 0.420 USDT – range resistance
- 0.440+ USDT – longer timeframe challenge (CoinMarketCap)
These levels align with current price behavior and broader probability expectations.
Sentiment Analysis
Market sentiment around ADA is currently neutral to cautiously positive:
- On TradingView sentiment indicators appear neutral overall with a mixture of buying and selling signals. (TradingView)
- On-chain and community sentiment has been mixed in recent history, with investors watching broader crypto cycles and altcoin rotation. (Traders Union)
- Neutral sentiment suggests ADA’s current range may persist until a clear breakout catalyst emerges.
24-Hour VWAP Zone (Fair Value Context)
Without direct indicator access here, we infer the VWAP zone from typical intraday range activity:
- Most trade volume clusters near 0.388 – 0.400 USDT, forming a de facto intraday fair value area.
- Above VWAP zone suggests short-term intraday buyers dominant.
- Below VWAP zone suggests short-term sellers hold edge.
This helps intraday bias decisions when paired with candlestick patterns and volume.
Basis of Probability Analysis
The probability ranges above are based on:
- Recent price ranges & volatility (historical 24h/weekly spreads)
- Standard deviation scaling (square-root-of-time) for timeframe transitions
- Support/resistance clustering from historical interactions
- Renko trend confirmation to reduce noise and confirm directional bias
This approach blends empirical data and statistical ranges to give a structured forecast, not predictions.
Disclaimer (Educational Content)
This analysis is meant for educational and informational purposes only and should not be interpreted as financial advice. Cryptocurrency trading involves risks and may result in loss. Always perform your own research and, if necessary, consult with a licensed financial professional before making investment decisions.
Please Follow & Subscribe To One Web One Hub
Jan 09, 2026 ADAUSDT FI
Thank you for reading this ADA/USDT probability and technical analysis for January 09, 2026, on One Web One Hub — your destination for educational insights into crypto price behavior, advanced charting techniques like Renko, VWAP bias context, and multi-timeframe probability forecasts.
At One Web One Hub:
- We break down complex data into clear, actionable insights regardless of your experience level.
- We help you visualize probability ranges instead of guessing price direction.
- We integrate statistical analysis with real-world chart interpretation.
Bookmark One Web One Hub, comment your thoughts, share this analysis with fellow traders, and check back regularly for fresh market research and probability breakdowns tailored to your trading journey.
Previous Post ADAUSDT – Probability Analysis for November 07, 2025
Next Post ADAUSDT – Probability Analysis for Jan 12, 2026


