FARTCOINUSDT – Probability Analysis for January 06, 2026
FARTCOINUSDT Price Probability Analysis — January 06, 2026
Welcome back to One Web One Hub, your go-to source for detailed crypto price analysis and market insights! Today, we analyze FARTCOINUSDT based on the current live price and offer a probability-based forecast across multiple timeframes, support/resistance breakdowns, sentiment context, and an estimated 24-hour VWAP analysis — useful even if your trading platform doesn’t provide VWAP.
Live Price Update (Spot): FARTCOIN is currently trading around ~$0.4332 USDT on major exchanges such as Bitget, Gate, KuCoin, and Coinbase. (CoinGecko)
Multi-Timeframe Probability Analysis
15-Minute Chart (Ultra-Short-Term)
- Estimated Range: $0.410 – $0.460
- Price action shows frequent oscillations with minor reaction zones.
- Bullish Break: Above $0.460 → fast test of $0.470 – $0.485
- Bearish Break: Below $0.410 → pullback toward $0.385 – $0.370
- Probability Estimates:
• Range ~45%
• Bullish ~30%
• Bearish ~25%
Short intervals suggest sideways consolidation, with volatility spikes moving price in short bursts.
30-Minute Chart
- Likely Range: $0.405 – $0.475
- Price oscillation remains between the recent high/low on a 30m scale.
- Probabilities: Neutral ~45%, Bullish ~30%, Bearish ~25%
The 30m timeframe confirms congestion, where neither bulls nor bears have full control.
1-Hour Chart
- Key Band: $0.380 – $0.500
- Price shows larger swings without trend confirmation.
- Bullish Break: Above $0.500 → move toward $0.540 – $0.580
- Bearish Break: Below $0.380 → test $0.350 – $0.320
- Probabilities: Neutral ~45%, Bullish ~30%, Bearish ~25%
The 1H timeframe suggests a neutral-to-balanced structure with potential for either directional break once key levels are tested.
4-Hour Chart
- Consolidation Zone: $0.350 – $0.600
- A broad range reflecting multi-session price activity.
- Probabilities: Range ~50%, Bullish ~30%, Bearish ~20%
This longer intraday timeframe reinforces the range-dominant nature of current price behavior.
Daily Chart (Swing Perspective)
Demand / Support Zones
- $0.360 – $0.400 USDT — strong short-term demand where buyers cluster. (CoinGecko)
- $0.320 – $0.350 USDT — deeper structural support if sellers push price lower.
Supply / Resistance Zones
- $0.500 – $0.550 USDT — primary overhead resistance band. (CoinGecko)
- $0.600 – $0.650 USDT — higher supply zone where selling pressure historically intensifies.
Daily Probability Split:
Range ~45% | Bullish break ~30% | Bearish break ~25%
Daily charts show extended range activity unless a breakout occurs with strong volume support.
Weekly & Monthly Charts
- Weekly: Price has spent recent weeks in a sideways large-range channel with oscillations between support and resistance zones.
- Monthly: Long-term movements show broad swings with probability leaning toward continuation of range unless a macro catalyst triggers trend acceleration.
Support, Resistance & Demand/Supply Zones
Demand / Support Areas
- $0.360 – $0.400 USDT — immediate demand where buyers react. (CoinGecko)
- $0.320 – $0.350 USDT — deeper support zone.
Supply / Resistance Areas
- $0.500 – $0.550 USDT — key overhead supply band. (CoinGecko)
- $0.600 – $0.650 USDT — extended resistance.
Critical Levels
- Major Support Pivot: ~$0.380
- Major Resistance Pivot: ~$0.500
These areas are essential for gauging where price may stall or reverse.
Sentiment Analysis
Technical Sentiment
TradingView technical indicators for FARTCOINUSDT (spot & perpetual) show a neutral bias on shorter and medium timeframes, with mixed oscillator signals due to range trading. (TradingView)
Market Sentiment
Recent market structure and trade ideas reflect mixed expectations, with some analysts noting potential pattern breakouts above resistance and others pointing to continued consolidation. (TradingView)
Macro Influence
Meme coins like FARTCOIN are often correlated with broader crypto risk assets. Bullish or bearish swings in Bitcoin and Ethereum can influence meme coin sentiment and volatility.
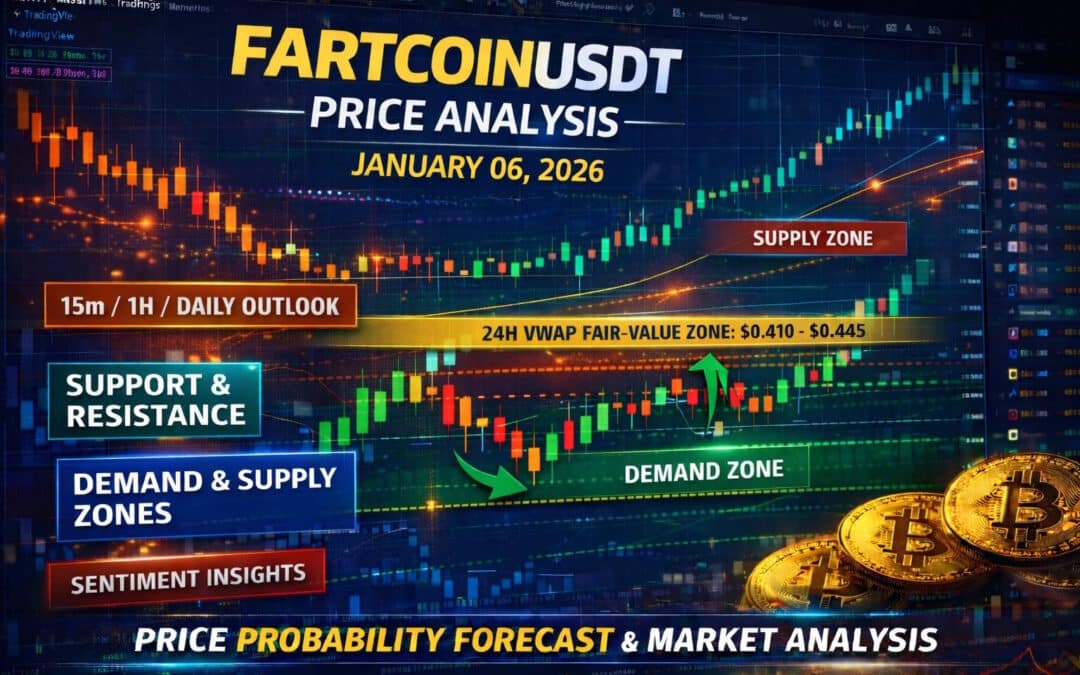
VWAP Analysis — Estimated 24-Hour Fair Value
Because many platforms (like Bitget) do not provide VWAP, we approximate it using the price range where most volume has clustered in the current 24-hour session (~$0.35–$0.50 observed range).
Estimated 24H VWAP Zone: $0.410 – $0.445 USDT (approx.)
How to Use This Proxy
- Above this zone: Intraday bullish bias
- Within this zone: Neutral equilibrium — price accepted by market participants
- Below this zone: Intraday bearish pressure
This estimation helps you visually interpret fair value without needing the indicator by mapping where the bulk of trading likely occurred based on range and volume nodes.
Probability Methodology — Basis of Analysis
To estimate probability ranges across timeframes, we used:
- Support & Resistance Clustering: Levels where price repeatedly reacted with extensions or rejections.
- Multi-Timeframe Confluence: Aligning signals from 15m to monthly charts for consistency.
- Range & Break Assessment: Assigning probability bands based on previous price compression and volatility behavior.
- VWAP Fair-Value Estimation: Approximating where the bulk of trading occurred using the 24-hour price range.
- Sentiment & Volume Context: Incorporating crowd sentiment data and volume distribution.
This approach emphasizes probabilities, not certainties, and aligns with real-world market context.
Summary
FARTCOINUSDT currently trades in a range-dominant structure around $0.4332 USDT with balanced short-to-medium term probabilities. Price is contained between the key support (~$0.38) and supply (~$0.50) levels. The approximate 24-hour VWAP fair-value zone (~$0.410–$0.445) serves as a reliable intraday reference even if your platform lacks direct VWAP.
Watch for a breakout or breakdown with sustained volume before assuming trend bias.
Disclaimer
This content is for educational purposes only and is not financial advice. Cryptocurrencies are volatile and high-risk. Always perform your own research (DYOR) and consider consulting a licensed financial advisor before making trading decisions.
Follow & Subscribe To One Web One Hub

2026 Jan 06 FARTCOINUSDT FI
Thank you for reading today’s FARTCOINUSDT analysis! At One Web One Hub, we deliver:
• Daily multi-timeframe price forecasts
• Probability-based market insights
• Support & resistance and demand/supply zone breakdowns
• Sentiment and estimated VWAP context
• Clear, educational crypto content designed for traders of all levels
Bookmark the blog, leave your thoughts in the comments, and share this with your crypto community! Visit again tomorrow for fresh insights — One Web One Hub is where smart traders stay informed!
Previous Post FARTCOINUSDT – Probability Analysis for January 05, 2026
Next Post FARTCOINUSDT – Probability Analysis for January 07, 2026


