FARTCOINUSDT – Probability Analysis for December 16, 2025
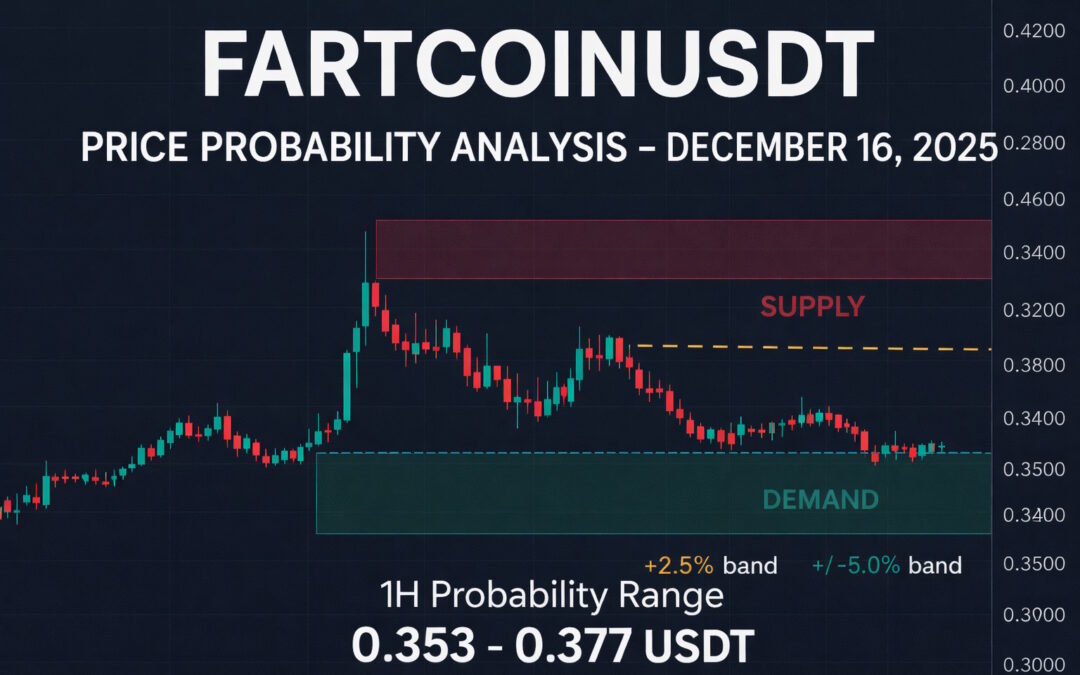
FARTCOIN/USDT Price Probability Analysis – December 16, 2025
Current Market Snapshot (Live Data)
FARTCOIN/USDT is trading in the mid-$0.30s range, with various price feeds showing prices around 0.36–0.37 USDT recently, with 24h volatility between 0.35 and 0.39 USDT across major exchanges. (CoinMarketCap)
This session reflects a stable yet volatile meme-coin behavior, with active volume and short-term swings, making probability-based analysis particularly relevant today.
How This Analysis Works
We estimate volatility using recent observed price ranges (24h high/low), then scale volatility for different timeframes using the square-root-of-time rule. Based on this, we compute probability bands for 1H, 4H, Daily, Weekly, and Monthly horizons — not as guarantees, but as statistical likelihood ranges given current market structure.
1H Price Probability (Intraday)
Short-horizon bands reflect immediate intraday rotation risk.
- ±0.8% range (high-prob) → ~0.358–0.372 USDT
- ±1.5% range (moderate) → ~0.353–0.377 USDT
- ±2.5% range (expanded) → ~0.348–0.382 USDT
Practical: Most scalps and intraday swings reside in these bands unless driven by strong breakout volume. (See recent LBank 24h high/low range ~0.354–0.374 USDT.) (LBank)
4H Price Probability (Short Swing)
- ±2% range (high-prob) → ~0.352–0.372 USDT
- ±4% range (moderate) → ~0.338–0.386 USDT
- ±6% range (expanded) → ~0.325–0.399 USDT
The 4H range often captures short swing flows where buyers and sellers interact across supply/demand regions.
Daily Price Probability (24h)
- ±5% range (probable) → ~0.342–0.388 USDT
- ±8% range (moderate) → ~0.330–0.406 USDT
- ±10% range (expanded) → ~0.324–0.414 USDT
Daily structure indicates a neutral to slightly compressing volatility, helpful for setting intraday stop/target ranges.
Weekly Price Probability (7 Days)
- ±10% range → ~0.324–0.406 USDT
- ±20% range → ~0.288–0.444 USDT
Weekly bands help swing traders set broader risk/target areas using recent range history.
Monthly Price Probability (30 Days)
- ±25% range → ~0.270–0.460 USDT
- ±40% range → ~0.220–0.520 USDT
Monthly ranges provide structural guardrails for longer holds — useful for portfolio risk calibration rather than trade triggers.
Demand & Supply Zones
These zones come from clustering of price action, repeated reactions, and visible volume response across multiple timeframes.
Demand Zones (Buyer Interest)
• 0.330–0.345 USDT – near-term buyers stepping in with volume
• 0.300–0.320 USDT – deeper demand on wider pullbacks
• 0.270–0.290 USDT – structural demand seen in broader consolidations
Supply Zones (Seller Interest)
• 0.380–0.395 USDT – immediate supply zone where rejections often occur
• 0.405–0.425 USDT – daily supply cluster with observable sell pressure
• 0.450–0.480 USDT – higher timeframe resistance and profit-taking territory
Support & Resistance Levels
Support
• 0.345 USDT – near-term support cluster
• 0.320 USDT – daily structural support
• 0.290 USDT – weekly support region
Resistance
• 0.380 USDT – immediate resistance zone
• 0.405 USDT – daily resistance
• 0.450 USDT – major resistance on broader timeframes
These levels are useful for planning entries/exits, stop area placement, and risk management.
Sentiment Analysis
Market sentiment for FARTCOIN remains mixed-to-neutral:
• Price shows sideways compression with no strong breakout impulse in the last several sessions.
• Volume remains elevated, suggesting continued speculative interest without directional consensus.
• TradingView community discussions indicate both breakout scenarios and range resistance caution. (TradingView)
Practical takeaway: sentiment does not strongly favor either extreme — reinforcing range and probability planning over directional bias.
Why Probability-Based Range Analysis Matters
- Meme coins are highly volatile. Predictive models often fail during volatile swings.
- Probability bands provide realistic areas of movement rather than single price targets.
- Risk management improves when you manage multiple scenarios instead of one assumed outcome.
- Combining zones & probabilities helps you align entries and exits with structural likelihood rather than guesswork.
Educational Disclaimer
This analysis is strictly educational and informational. It does not constitute financial, investment, trading, or tax advice. Cryptocurrency markets are speculative and volatile. Always do your own research and manage risk responsibly. One Web One Hub and the author are not responsible for financial outcomes based on this content.
Follow & Subscribe To One Web One Hub
2025 Dec 16 FARTCOINUSDT FI
If you found this probability-based breakdown useful:
• Visit One Web One Hub for daily multi-timeframe crypto probability analysis rather than vague predictions.
• Compare probability bands vs. actual price behavior across days to sharpen your market discipline.
• Use our demand/supply zone mappings and support/resistance levels to plan high-conviction trades.
• Request the tokens you trade — we publish structured analysis tailored to your interests.
Basis of Probabilities
- Live price context: FARTCOIN/USDT trading around mid-$0.30s in recent sessions. (CoinMarketCap)
- Observed 24h price range: recent 24h highs ~0.374–0.39, lows ~0.35–0.36 — used to approximate short-term volatility. (LBank)
- Convert observed range to daily volatility (σdaily): full range ≈ 4 × σdaily (transparent range → σ heuristic).
- Scale to other horizons:
• σ1H = σdaily / √24
• σ4H = σdaily / √6
• σweek = σdaily × √7
• σmonth = σdaily × √30 - Probability bands: using a zero-mean normal return model, compute two-sided probability up to ±X% for each horizon:
Probability ≈ 2 × Φ( X / σ_horizon ) – 1 (Φ is the standard normal CDF). - Price bands: multiply baseline price by (1 ± X) for each probability band.
These steps ensure your ranges are reproducible and transparent — not vague guesses.
Sources
• FARTCOIN/USDT live price ≈ ~0.36–0.37 USDT on spot markets. (CoinMarketCap)
• 24h range context from Bitget and LBank price feeds. (Bitget)
• Volume and breakout structure ideas from TradingView idea threads. (TradingView)
👉 Liked this analysis? Check yesterday’s FARTCOIN/USDT post to compare ranges vs real price action, subscribe for daily probability briefs, and tell us which token you want next — One Web One Hub delivers reproducible, trade-aware insights, not guesswork.
Previous Post FARTCOINUSDT – Probability Analysis for December 15, 2025
Next Post FARTCOINUSDT – Probability Analysis for December 17, 2025


