FARTCOINUSDT – Probability Analysis for December 07, 2025
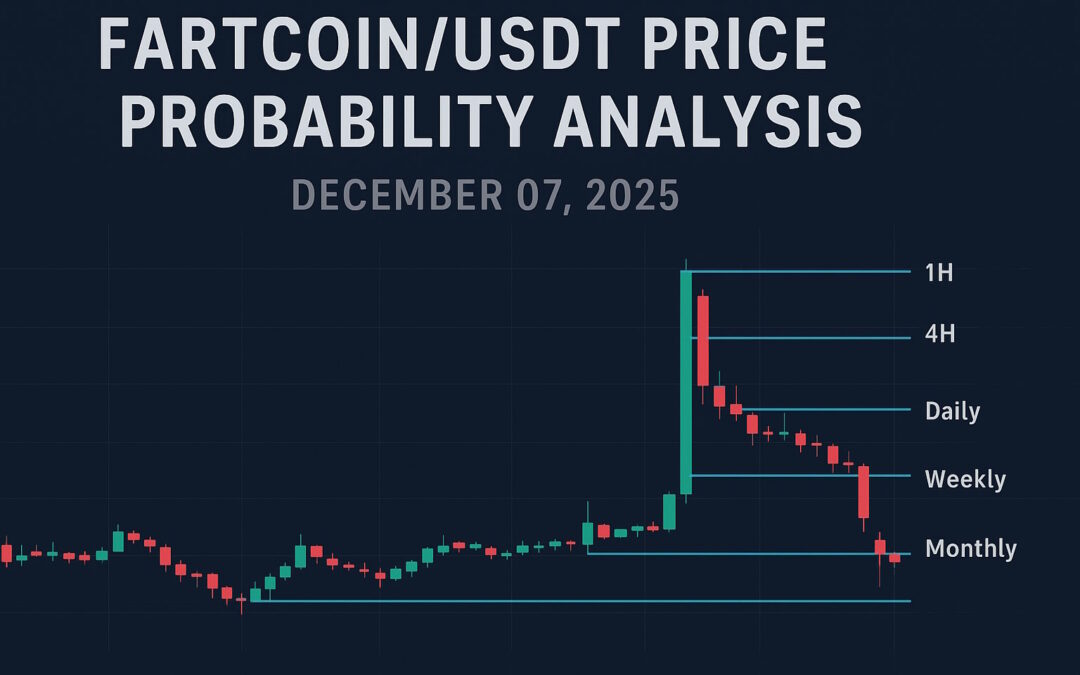
FARTCOIN/USDT Price Probability Analysis — December 07, 2025
Current market snapshot (live feeds)
TradingView and major exchange feeds show FARTCOIN trading in the mid-$0.30s range. For this post we adopt a TradingView / market-aggregator baseline near 0.376 USDT for the price math below. (TradingView)
Binance perp/spot snapshots show the recent 24-hour extremes we used to estimate short-term volatility: 24h high ≈ 0.4161 USDT and 24h low ≈ 0.3666 USDT. These are the live numbers used to build the probability model. (Binance)
Liquidity and order-book context (Binance / live order-book viewers) show active volume but noticeable intra-exchange spreads for this token — check your trading venue before executing large orders. (CryptoMeter)
What this post contains
• Reproducible probability ranges for 1H, 4H, Daily, Weekly and Monthly horizons (each horizon lists model probability and the resulting price band).
• Demand & supply zones, support & resistance levels from recent price clustering.
• Sentiment snapshot (social + volume).
• Full, explicit “Basis of probabilities” arithmetic at the end so you can reproduce every number.
This is educational content — see the clear disclaimer at the end.
Quick headline numbers
• Baseline price used for bands: 0.376 USDT (TradingView / aggregator baseline). (TradingView)
• 24-hour high / low used for volatility: 0.4161 / 0.3666 USDT (Binance snapshot). (Binance)
• Derived daily volatility (σdaily) using the transparent range→σ heuristic (explained at the end): ≈ 3.162% per day.
• All probabilities below assume log-returns are approximately normal with the σ values derived from the steps above.
1H / 4H / Daily / Weekly / Monthly — Probability ranges and price bands
How to read: each horizon shows (a) the ±% band, (b) the model probability that price stays inside that band for the horizon, and (c) the price band (lower → upper) computed as baseline × (1 ± band). These are model probabilities under the stated assumptions (not guarantees).
1H (intraday scalps)
σ1H ≈ 0.645% (derived from σdaily / √24)
• ±1% band — Probability ≈ 87.87% → Price band: 0.37224 — 0.37976 USDT.
• ±2% band — Probability ≈ 99.81% → Price band: 0.36848 — 0.38352 USDT.
• ±3% band — Probability ≈ ≈100.0% → Price band: 0.36472 — 0.38728 USDT.
(Use 1H bands for tight scalps — confirm order-book depth and fees on your exchange.)
4H (short swings)
σ4H ≈ 1.291% (derived from σdaily / √6)
• ±2% band — Probability ≈ 87.87% → Price band: 0.36848 — 0.38352 USDT.
• ±5% band — Probability ≈ 99.99% → Price band: 0.35720 — 0.39480 USDT.
• ±8% band — Probability ≈ ≈100.0% → Price band: 0.34592 — 0.40608 USDT.
(4H bands are useful for multi-session swing entries and exits; look for volume confirmation.)
Daily (next 24 hours)
σdaily ≈ 3.162%
• ±5% band — Probability ≈ 88.62% → Price band: 0.35720 — 0.39480 USDT.
• ±8% band — Probability ≈ 98.86% → Price band: 0.34592 — 0.40608 USDT.
• ±10% band — Probability ≈ 99.84% → Price band: 0.33840 — 0.41360 USDT.
(Under the current realized range, the model suggests a high chance price stays inside daily ±8–10% bands.)
Weekly (next 7 days)
σweek ≈ 8.366%
• ±10% band — Probability ≈ 76.80% → Price band: 0.33840 — 0.41360 USDT.
• ±20% band — Probability ≈ 98.32% → Price band: 0.30080 — 0.45120 USDT.
(Weekly bands widen significantly; use them for position sizing and swing-trade planning.)
Monthly (next 30 days)
σmonth ≈ 17.32%
• ±25% band — Probability ≈ 85.11% → Price band: 0.28200 — 0.47000 USDT.
• ±50% band — Probability ≈ 99.61% → Price band: 0.18800 — 0.56400 USDT.
(Monthly bands capture larger structural moves — best used for portfolio risk planning rather than intraday signals.)
Key technical zones — support, resistance, demand & supply
These levels are drawn from visible clustering on TradingView and exchange prints across major venues (Binance, aggregated feeds). Always reconfirm on the exchange you trade.
Immediate resistance/supply
• 0.34 — 0.36 USDT — near-term overhead resistance where recent attempts paused/rejected. (TradingView)
• 0.45 — 0.60 USDT — higher supply/profit-taking area if a convincing breakout occurs (liquidity thins above this band).
Immediate support/demand
• 0.29 — 0.31 USDT — near-term support and demand area where buyers re-entered after recent dips. (CryptoMeter)
• 0.24 — 0.26 USDT — deeper structural support if market sentiment turns sharply bearish.
Demand zone to watch (accumulation)
• 0.28 — 0.31 USDT — a practical accumulation range — look for rising buy volume to confirm.
Supply zone to watch (profit taking)
• 0.34 — 0.38 USDT — repeated rejections and wick activity show selling pressure; a clean break & hold above this area increases odds of higher tests.
Sentiment snapshot
• Exchange/aggregate snapshots show active trading volume and mixed intra-day moves; CoinMarketCap / CoinGecko page activity indicates continued community discussion and attention. (CoinMarketCap)
• Social tone: mixed with pockets of bullish calls — not uniformly euphoric. Recent note-style stories (listings, token-specific updates) drive short bursts of activity. (CoinMarketCap)
• Practical read: sentiment is mixed-to-slightly-bullish. Combine social signals with on-chain flows and exchange inflows/outflows to increase conviction before larger commitments.
Trading & risk notes
• Prices and liquidity differ across venues — spot, perpetuals, and exchange feeds can show different numbers. Always confirm the price on the exchange you use and check order-book depth before placing market orders. (CryptoMeter)
• The probability ranges here assume the volatility estimate holds; if volatility spikes (news, whale action, exchange events) the ranges change quickly. Use stop-losses and position sizing appropriate to your risk tolerance.
Educational disclaimer (IMPORTANT)
This post is educational only. It is NOT financial, investment, trading, or tax advice. The probability ranges are model outputs based on explicit assumptions (see the “Basis of probabilities” section below). Past performance is not a guarantee of future results. Always perform your own research and apply appropriate risk management.
Engage with One Web One Hub
2025 Dec 07 FARTCOINUSDT FI
If you value transparent, assumption-driven crypto analysis (not vague predictions), One Web One Hub publishes daily, reproducible probability briefs for traders:
• Multi-horizon probability bands (1H, 4H, Daily, Weekly, Monthly) you can reproduce on your exchange.
• Clear support/resistance and demand/supply zones with trading-aware notes.
• Sentiment snapshots and practical checklists (order-book, on-chain inflows/outflows, funding/open interest).
Visit One Web One Hub, request the tokens you trade, and join a community focused on disciplined, reproducible trading insights.
Basis of probabilities — explicit arithmetic & formulas
Below are the exact steps used so you (or your readers) can reproduce the math.
- Baseline/price used: TradingView / aggregator mid ≈ 0.376 USDT. (TradingView)
- 24h high / low (Binance perp/spot snapshots): 0.4161 / 0.3666 USDT. (Binance)
- Full observed 24h absolute range = 0.4161 − 0.3666 = 0.0495 USDT.
- Midpoint = (0.4161 + 0.3666) / 2 = 0.39135 USDT.
- Relative 24h range = 0.0495 / 0.39135 ≈ 0.1265 → 12.65% (full range as fraction of midpoint).
- Heuristic conversion range → daily σ: rule-of-thumb used here is full range ≈ 4 × σdaily → σdaily ≈ 0.1265 / 4 ≈ 0.03162 → 3.162% per day.
• This is a quick, transparent estimator; you may substitute realized volatility from intraday returns or an exchange volatility indicator if you prefer a different input. - Convert σdaily to other horizons with the square-root-of-time rule:
• σ1H = σdaily / √24 ≈ 0.03162 / 4.899 ≈ 0.00645 → 0.645%.
• σ4H = σdaily / √6 ≈ 0.03162 / 2.449 ≈ 0.01291 → 1.291%.
• σweek = σdaily × √7 ≈ 0.03162 × 2.646 ≈ 0.08366 → 8.366%.
• σmonth = σdaily × √30 ≈ 0.03162 × 5.477 ≈ 0.17320 → 17.320%. - Compute two-sided probability that returns stay inside ±X% under a zero-mean normal model:
Probability = 2 × Φ( X / σ ) − 1 = erf( X / (σ × √2) ), where Φ is the standard normal CDF and erf is the error function. - Price bands: baseline × (1 ± X). Example: daily ±8% band → lower = 0.376 × (1 − 0.08) = 0.34592 USDT; upper = 0.376 × (1 + 0.08) = 0.40608 USDT.
Sources / live pages consulted
• TradingView — FARTCOIN / USDT chart & aggregated listings. (TradingView)
• Binance — 24h high / low and perp/spot snapshots (used for volatility input). (Binance)
• CoinMarketCap — live aggregate price & community metrics. (CoinMarketCap)
• CoinGecko — live snapshot & volume context. (CoinGecko)
• Cryptometer & live orderbook viewers — liquidity / order-book checks. (CryptoMeter)
Next Post FARTCOINUSDT – Probability Analysis for December 08, 2025
Previous Post FARTCOINUSDT – Probability Analysis for December 06, 2025


