SOLUSDT – Probability Analysis for November 24, 2025
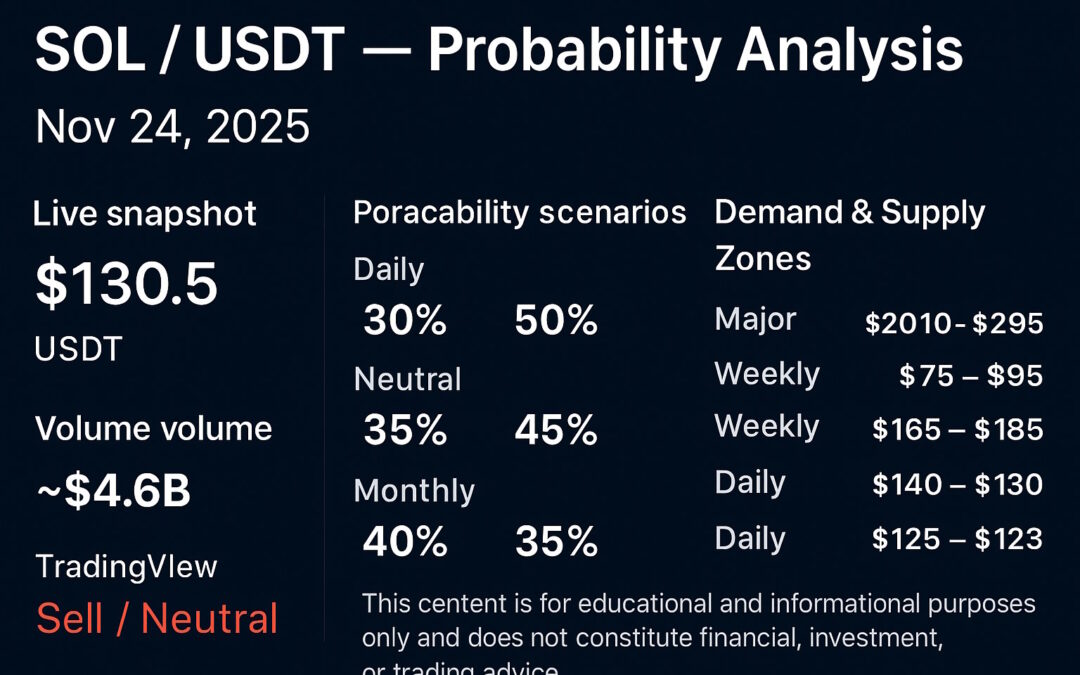
SOL / USDT — Probability Analysis (Nov 24, 2025)
Live snapshot (verify live before trading)
- Current SOL/USDT price (approx): $130.5 USDT. (TradingView)
- 24-hour trading volume: ~$4.6B (high liquidity across exchanges). (CoinMarketCap)
- TradingView technical summary (short→medium timeframes): shows a Sell / Neutral bias on many indicator stacks today (use the TradingView technicals gauge on the SOLUSDT page for the exact live read). (TradingView)
Quick note: crypto markets move fast — refresh TradingView / CoinMarketCap / Binance (or your exchange) for exact live ticks before trading. (TradingView)
Probability scenarios (reproducible thresholds)
I use simple, reproducible thresholds chosen to match SOL’s historical volatility profile:
- Daily: ±3%
- Weekly: ±8%
- Monthly: ±20%
Daily (24-hour)
- Bullish (> +3%) — 30%
- Neutral (±3%) — 50%
- Bearish (> −3%) — 20%
Why (daily): price is consolidating around the current level with TradingView technicals leaning neutral/sell; short-term momentum is weak so the single largest outcome is rangebound for the next 24 hours, while volume and liquidity make both quick re-tests of nearby levels and intraday breakouts possible. (TradingView)
Weekly (7-day)
- Bullish (> +8%) — 35%
- Neutral (±8%) — 45%
- Bearish (> −8%) — 20%
Why (weekly): seven days allows macro and ecosystem catalysts (on-chain activity, funds flows, major inflows/outflows, or network news) to create a clearer trend. SOL’s deep liquidity raises the chance of a meaningful continuation move if momentum appears, but absent a clear breakout, the neutral bucket remains the largest. Historical threaded trade ideas on TradingView show both short and medium-term scenarios, so we weight the weekly tail probabilities accordingly. (TradingView)
Monthly (30-day)
- Bullish (≥ +20%) — 40%
- Neutral (±20%) — 35%
- Bearish (> −20%) — 25%
Why (monthly): over a month, SOL can move materially on macro changes, major listings, or ecosystem upgrades. Given SOL’s prior multi-leg moves (and the large market cap/liquidity that can fuel sustained trends), the bullish tail is the largest on the 30-day horizon — but sizeable downside remains possible and therefore non-negligible. (CoinMarketCap)
Demand & Supply Zones — where buyers and sellers are likely to cluster
(Zones are ranges — draw rectangles on your chart rather than single price lines.)
Monthly/Major
- Major Supply Zone: $250 – $295 USDT — long-term high / seller concentration (historical ATH band). (CoinMarketCap)
- Major Demand Zone: $75 – $95 USDT — deep accumulation from earlier cycle lows.
Weekly/Intermediate
- Weekly Supply Zone: $165 – $185 USDT — prior weekly swing peaks and reversal clusters. (TradingView)
- Weekly Demand Zone: $115 – $130 USDT — recent consolidation/basement where buyers previously stepped in (current price sits inside/near this band). (TradingView)
Daily/Short-term
- Daily Supply: $140 – $155 USDT — intraday resistance and recent local highs. (TradingView)
- Daily Demand: $125 – $128 USDT — short-term support where recent bounces found buyers. (TradingView)
Support & Resistance — quick reference levels
- Immediate support (short): $125 – $128 USDT (daily demand band). (TradingView)
- Near support (weekly): $115 – $130 USDT (weekly demand). (hashkey.com)
- Immediate resistance: $140 – $155 USDT (daily supply). (TradingView)
- Key monthly resistance (major): $250 – $295 USDT (monthly supply / ATH region). (CoinMarketCap)
Action cues to watch
- If SOL closes decisively above $155 on expanding volume → increase weekly/monthly bullish probabilities (shift weight toward bullish). (TradingView)
- If SOL breaks below $115 with heavy selling → raise weekly/monthly bearish probability and expect larger drawdown scenarios. (TradingView)
Methodology (reproducible)
- Collect live inputs: current price, 24-hour high/low, 24-hour volume and exchange listings (TradingView, CoinMarketCap, Binance). (TradingView)
- Baseline technicals: read TradingView’s “Technicals” summary on SOLUSDT for the timeframe you’re analyzing to set a neutral/buy/sell baseline. (TradingView)
- Pick thresholds: daily ±3%, weekly ±8%, monthly ±20% (adjust to your preference or risk tolerance).
- Identify zones: visually mark consolidation bases before large impulses (demand) and clusters of swing highs/rejections (supply); confirm with volume spikes on the original move. (TradingView)
- Assign baseline probabilities: start neutral-biased when TradingView shows neutral; then nudge probabilities using: (a) price position relative to zones, (b) volume strength/liquidity, (c) technical consensus, (d) macro or ecosystem catalysts.
- Recompute whenever a major event (listing, upgrade, macro news) or a decisive breakout/breakdown changes the inputs.
Risk & trade-management notes
- SOL is a large-cap crypto but still volatile — size positions to your risk budget and always use stop losses or risk limits.
- Futures/perps and leverage amplify moves and liquidations — avoid heavy leverage unless you fully understand margin/funding mechanics.
- Recompute probabilities after major events (network upgrades, listings, macro shocks) — the model is only as good as its live inputs. (TradingView)
Disclaimer
This content is for educational and informational purposes only and does not constitute financial, investment, or trading advice. Do not interpret this analysis as a recommendation to buy, sell, or hold SOL or any other asset. Always do your own research, consider your personal risk tolerance, and consult a licensed financial advisor if you need personalized guidance.
Engage with One Web One Hub
SOLUSDT NOV 24 2025 FI
At One Web One Hub, we publish daily, reproducible market frameworks you can reuse: clear probability buckets across time horizons, mapped supply & demand zones, and practical trade management guidance. Bookmark the post, subscribe for daily updates, and join our community to sharpen your trading process.


