
FARTCOINUSDT – Probability Analysis for November 05, 2025
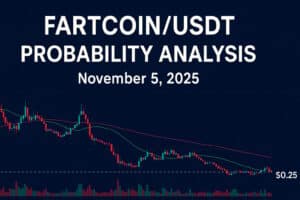
FARTCOINUSDT — Probability Analysis (November 5, 2025)
Data sources: TradingView technical snapshots and CoinMarketCap live feeds. This is market commentary, not financial advice.
Live snapshot (what I used)
- Price: ≈ $0.25 USDT (aggregated feed). (CoinMarketCap)
- 24-hour volume: elevated (large relative to token size; CoinMarketCap reports >$100M 24h volume recently). (CoinMarketCap)
- TradingView composite technicals: Hold → Strong Sell on many timeframes (no clean multi-timeframe buy signal). (TradingView)
Quick take: price has declined materially from October peaks and is trading in the low $0.20s–$0.30 band. Volume is high — that increases both downside risk and the possibility of sharp short squeezes. (CoinMarketCap)
How I build probabilities (basis/methodology)
I assign probabilities by combining these measurable factors (each explained so you can reproduce/verify):
- Price action (weight ~30%) — recent closes, wick structure, higher-low / lower-high patterns across daily/weekly candles.
- Volume confirmation (weight ~25%) — whether rallies or drops are accompanied by expanding volume across exchanges. High volume on down days = distribution; on up days = accumulation. (I used CoinMarketCap aggregated volume and TradingView market feeds). (CoinMarketCap)
- Multi-timeframe technicals (weight ~20%) — TradingView composite signals (5m → 1h → 1D → 1W) and MA alignments used as objective rules for trend confirmation. (TradingView)
- Liquidity & order-book breadth (weight ~10%) — whether multiple exchanges show similar price/volume (reduces exchange-specific spikes). I cross-checked TradingView markets. (TradingView)
- Macro & sentiment / on-chain cues (weight ~15%) — BTC direction, social momentum, large wallet flows (qualitative; raises or lowers probability bands). Sources: market commentary & exchange flows. (CryptoDnes.bg)
I combine the above into a probability estimate: higher-weight items (price + volume + technicals) move the needle most. Where those three align bullish, the probability of upside rises; if they align bearish, the downside probability dominates.
Daily outlook (1–3 days)
Current read: price trading ~$0.25; daily momentum is neutral → bearish (no strong buying conviction). TradingView daily indicators are neutral/bearish and past 24–72h shows heavy down candles. (CoinMarketCap)
Key short-term levels
- Immediate support: $0.22–$0.24 (recent low / liquidity cluster).
- Immediate resistance: $0.30–$0.33 (recent intraday bounces).
- Break-flip zone (to consider bias shift): >$0.38 (needs sustained reclaim).
Probabilities (next 24–72 hours)
- Consolidation / mild further downside — 55%
Rationale: price recently fell sharply, TradingView composite reads sell/hold, and volume on down moves is strong — favors range or further chop lower. (TradingView) - Volumetric bounce / short squeeze (fast spike to $0.30–$0.38) — 30%
Rationale: Elevated liquidity and high 24h volume make sharp bounces possible if buyers step in. Requires expanding intraday volume to validate. (CoinMarketCap) - Sustained bullish breakout (> $0.38) — 15%
Rationale: would require clear multi-timeframe confirmation (1h+ closes above $0.38 with rising volume) — currently unlikely based on composite technicals. (TradingView)
Weekly outlook (1–4 weeks)
Current read: weekly price structure shows a corrective/downward bias — weekly candles with upper wicks and bodies near lows. Weekly moving averages are not yet reclaimed. (CoinMarketCap)
Key weekly levels
- Support band: $0.18–$0.24 (deeper liquidity).
- Resistance band: $0.45–$0.50 (major swing top area to flip medium-term).
Probabilities (next 1–4 weeks)
- Neutral to mildly bearish — 60%
Basis: weekly structure remains weak; TradingView weekly technicals show sell pressure; absent a big macro risk-on or token-specific catalyst, alts often drift. (TradingView) - Range/bottoming (absorption between $0.18–$0.33) — 25%
Basis: large volume can be absorbed, leading to multi-week base formation. - Bullish re-acceleration toward $0.50+ — 15%
Basis: requires consistent cross-exchange accumulation and a clear shift in BTC/risk sentiment.
Monthly outlook (1+ months)
Current read: the monthly picture is vulnerable. October finished with a large swing and November starts with a material drawdown — monthly candle risk is to the downside unless sustained inflows appear. (CoinMarketCap)
Probabilities (next 1–3 months)
- Neutral-to-mildly bearish (sideways or lower) — 65%
Rationale: without a macro rotation into alts or a token-specific positive catalyst (listings, tokenomics news, viral social push), the medium-term is more likely to be non-committal or gradually weaker. Volume and weekly closes must improve to beat this. (CoinMarketCap) - Constructive recovery/accumulation into a new uptrend — 25%
Rationale: possible if accumulation at current prices occurs across exchanges and BTC leads a strong alt-rotation. - Deep correction / extended bear phase — 10%
Rationale: if support at $0.18–$0.22 breaks on high volume and macro risk increases, the token could see extended weakness.
Concrete confirmation rules (how you can verify a signal)
Use these objective checklist rules before committing meaningful capital:
- Intraday (scalp / short-term): two consecutive 15-minute candle closes above $0.30 with 15-min volume > recent 15-min average + a successful retest to $0.30 (holds as support).
- Swing (1–7 days): one hourly close > $0.38 with hourly volume above recent hourly average and short MA (20h) crossing above medium MA (50h).
- Trend flip (weekly/monthly): weekly close above $0.45–$0.50 with rising weekly volume and improving on-chain accumulation metrics.
If those checks fail and price breaks support on volume (e.g., daily close < $0.22 with expanded volume), treat the move as a distribution and tighten stops / reduce size.
Practical trade rules & risk management
- Do not chase a falling price: wait for the objective confirmation rules above.
- If you decide to trade a bounce, keep position size small (meme coin rule — <2–5% of total trading capital).
- Use stops sized to your risk tolerance: example — if entering on a confirmed $0.30 retest, stop below $0.26 (approx 10–13% risk).
- Prefer limit entries and reduce leverage during high-volatility events.
Sources (most important live references)
FARTCOINUSDT Nov 05 2025 FI
- CoinMarketCap — live price & 24h volume. (CoinMarketCap)
- TradingView — symbol charts, multi-timeframe technicals & market tabs. (TradingView)
- Exchange perp/spot feeds for cross-checks (Binance, BingX listings referenced). (CoinMarketCap)
Disclaimer:
The content on this website is for educational purposes only and not to be treated as financial advice. Please do your own research and DYORM.


