
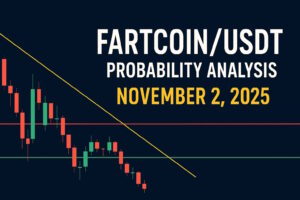
FARTCOINUSDT – Probability Analysis for November 2, 2025
FARTCOINUSDT — Probability Analysis (November 2, 2025)
Based on live chart snapshots from TradingView and aggregated price feeds (global audience — EU & USA timing implied). This is market commentary, not financial advice.
Live snapshot (what I used)
- Aggregated spot price: ≈ $0.34 USD (live feeds show price ~ $0.33–$0.34). (CoinMarketCap)
- TradingView technical snapshot: composite ratings for many timeframes show neutral → sell bias (no clear multi-timeframe buy signal). (TradingView)
- Volume context/liquidity remains elevated relative to market cap (spikes on intraday moves — typical for meme altcoins). (CoinGecko)
Headline summary
FARTCOIN/USDT is trading inside a corrective range after October swings. Lower-timeframe attempts to rally have lacked consistent follow-through on 15-minute and 1-hour candles and volume-backed confirmation on TradingView. The highest-probability near-term outcome is continued consolidation or mild downside unless price produces a clean, volume-backed breakout above the $0.42–$0.45 band. (TradingView)
Daily analysis (1D)
What the daily charts show now
- Price action: a sequence of small daily candles near $0.32–$0.36 after the mid-October highs — indicating loss of immediate bullish momentum. (CoinMarketCap)
- Indicators: daily RSI is neutral-to-slightly bearish; moving averages are flattening or turning down on some data feeds. TradingView’s technicals are currently not signaling a clear buy. (TradingView)
Key levels (daily)
- Support: $0.30 — $0.33 (short-term floor to defend)
- Resistance: $0.42 — $0.45 (clear rejection zone in recent weeks)
Daily probability (next 24–72 hours)
- Consolidation / mild downside — 60%
Price likely remains in a $0.30–$0.42 band as buyers and sellers re-price positions. - Bullish breakout — 30%
Only if the price closes daily above $0.45 on expanding volume. - Sharp downside — 10%
If large sell pressure hits and $0.30 support breaks with rising volume.
Trade note: on a daily basis, prefer waiting for a close above resistance with expanding volume before committing meaningful long size. (TradingView)
Short-term intraday view (5m / 15m / 1h)
What I checked on TradingView
- 5-minute: several breakout attempts (quick spikes) but followed by fast rejections — typical false-break behavior.
- 15-minute: no sustained multi-candle closes above the main resistance band; volume during break attempts has been mixed.
- 1-hour: structure is still rangebound; moving averages have not aligned into a clear trending formation.
Confirmation rules (use these objectively)
- 15m rule: two consecutive 15m closes above $0.42 with 15m volume > recent 15m average + successful retest → short entry.
- 1h rule (swing): one hourly close above $0.45 with hourly volume rising and MA alignment (20-hour > 50-hour) → swing long.
Until those are met, intraday breakouts are higher risk and likely to fail. (TradingView)
Weekly analysis (7D)
Current weekly structure
- Weekly candles show long wicks and smaller bodies recently — selling at higher levels remains evident. Weekly MAs are flattening. A weekly close above ~$0.50 would be required to flip the medium-term bias bullish confidently. (TradingView)
Weekly probability (1–2 weeks)
- Neutral to mildly bearish — 65%: expect range or slight downward pressure unless a large catalyst reverses flows.
- Bullish flip — 35%: possible if inflows are strong and weekly close > $0.50.
Monthly analysis (30D / medium term)
Monthly read (context)
- October closed as an indecisive/weak month for FARTCOIN — price remains below mid-month highs. To regain medium-term bullish momentum, price needs sustained action above $0.50 on a monthly scale. (CoinMarketCap)
Monthly probability (next 30 days)
- Neutral / mildly bearish — 70%: medium term likely to remain vulnerable without a big macro rotation into risk assets.
- Bullish monthly flip — 30%: only on sustained large-volume inflows and structural reclaiming of $0.50+.
Catalysts & risk factors to watch
- Macro/crypto market risk appetite: BTC direction often leads altcoin flows. A broad BTC rally could lift FARTCOIN; a BTC selloff would amplify downside.
- Exchange listings/delistings, viral social momentum, or influencer activity — meme coins react fast to social catalysts.
- On-chain whale moves — large transfers to exchanges often precede selling; monitor major wallet flows.
- Volume confirmation — any breakout needs expanding volume across multiple exchanges (TradingView markets page shows where liquidity is concentrated). (TradingView)
Practical trade plan (if you trade)
- Conservative long entry: wait for the 15m rule (two 15m closes above $0.42 with volume) then enter partial size; add on 1h confirmation above $0.45.
- Swing long: require 1-hour close > $0.45 + MA alignment; stop below the retest level (example: entry $0.46, stop $0.40).
- Short / hedge: consider on confirmed break & close below $0.30 with rising selling volume.
- Position sizing: meme coins are volatile — keep exposure small and use explicit stops. (TradingView)
Conclusion — probability call
FARTCOINUSDT Nov 02 2025 FI
- Most likely (60–70%): rangebound/mild downside as price consolidates between $0.30 and $0.42.
- Bullish (30–35%): sustained, volume-backed breakout above $0.45 leads to $0.50+ extension.
- Bearish (5–10%): rapid break below $0.30 on heavy volume leads to deeper correction.
I based this on TradingView live technicals and aggregated price feeds; the next clear directional signal will come from multi-timeframe candle closes with expanding volume (15m → 1h → daily). (TradingView)
Disclaimer:
The content on this website is only for educational purposes and not financial advice. Please do your own research and DYORM.


