FARTCOINUSDT – Probability Analysis for November 27, 2025
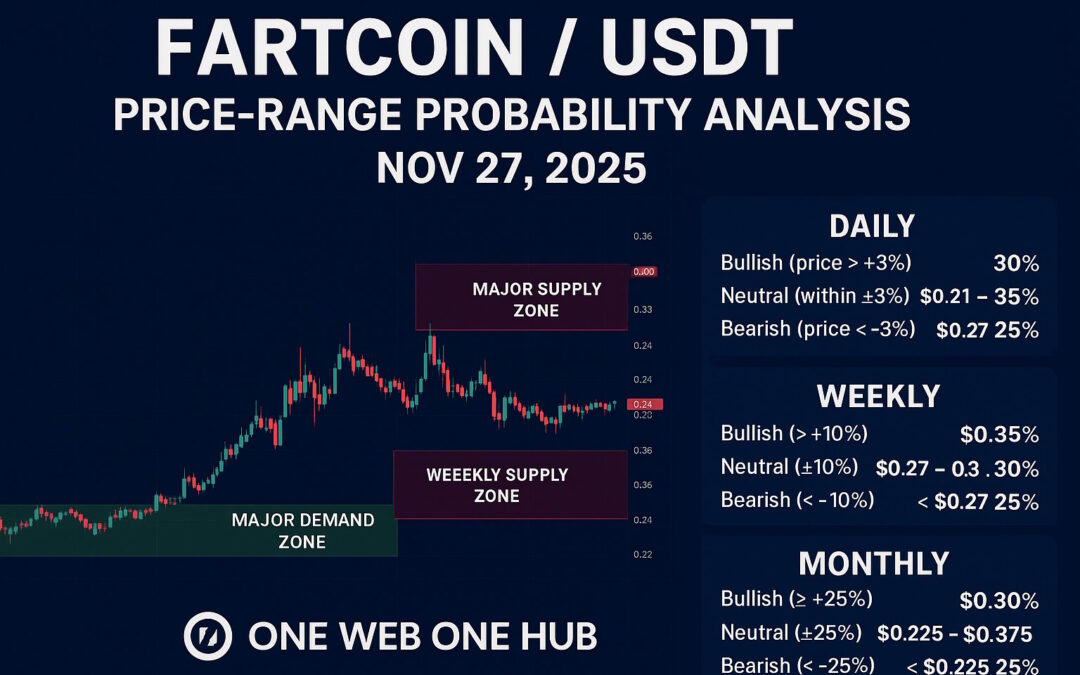
FARTCOIN / USDT — Price-Range Probability Analysis (Nov 27, 2025)
🔎 Live Market Snapshot (please verify live before trading)
- Recent price (spot/perp, sample snapshot): ≈ $0.30 USDT. Data from CoinMarketCap indicates FARTCOIN still trades around this level. (CoinMarketCap)
- 24-Hour trading volume: high, in the order of hundreds of millions of USDT, indicating strong liquidity. (CoinMarketCap)
- On-chain / exchange context: FARTCOIN remains listed on multiple exchanges with active trading and liquidity.
⚠️ Crypto markets move fast — always double-check live quotes (on TradingView / CoinMarketCap / your exchange) right before making any trade.
📊 Price-Range Probability Scenarios
Assumptions / Thresholds:
- Daily: ± 3%
- Weekly: ± 10%
- Monthly: ± 25%
These thresholds reflect the high volatility common to meme tokens like FARTCOIN. Feel free to adjust them to match your trading style or risk tolerance.
| Timeframe | Range (from ~$0.30) | Probability |
|---|---|---|
| Daily | > $0.309 (Bullish) — 30% $0.291–$0.309 (Neutral) — 45% < $0.291 (Bearish) — 25% | Balanced short-term structure; price near recent mid/high range; volume high but no strong breakout signal. |
| Weekly (7 days) | > $0.33 (Bullish) — 35% $0.27–$0.33 (Neutral) — 40% < $0.27 (Bearish) — 25% | Weekly window allows for catalysts (exchanges, social/news, flows). Liquidity suggests possible range expansion or continuation, but neutral remains most probable without a catalyst. |
| Monthly (30 days) | ≥ $0.375 (Bullish) — 40% $0.225–$0.375 (Neutral) — 35% < $0.225 (Bearish) — 25% | Over a month, meme coins can swing widely if social momentum or listing events hit. With active volume and exchange presence, bullish potential is meaningful — but downside remains real. |
Why these probabilities make sense:
- The high trading volume and broad listing create both opportunity and risk.
- The neutral-biased baseline (largest single bucket) reflects uncertainty without a clear catalyst.
- The bullish and bearish tails remain nontrivial because the token’s volatility and past swings show that both large upsides and downsides are possible.
📈 Demand & Supply Zones, Support & Resistance
Zones are ranges, not precise lines — draw them as rectangles on charts. Confirm with chart reaction, volume, and order-book liquidity if possible. As discussed in supply & demand zone theory. (Cointelegraph)
Major/Monthly Zones
- Major Demand Zone: $0.16 – $0.20 USDT — deep accumulation / long-term support band.
- Major Supply Zone: $0.32 – $0.36+ USDT — area of previous multi-week peaks and seller concentration. (One Web One Hub)
Weekly/Intermediate Zones
- Weekly Demand Zone: $0.23 – $0.26 USDT — recent consolidation/bounce area, likely interest from buyers.
- Weekly Supply Zone: $0.29 – $0.32 USDT — local weekly highs where rallies previously stalled or reversed.
Daily/Short-Term Zones
- Daily Demand (short-term): $0.27 – $0.29 USDT — intraday support zones, recent low-wicks.
- Daily Supply (short-term): $0.305 – $0.325 USDT — intraday resistance, recent rejection zones.
Support & Resistance Reference Levels:
- Support: $0.27 – $0.29 USDT (daily demand)
- Weekly floor support: $0.23 – $0.26 USDT (weekly demand)
- Immediate resistance: $0.305 – $0.325 USDT (daily/weekly supply)
- Key monthly resistance: $0.32 – $0.36 USDT (major supply zone)
Trading cues to monitor:
- Bullish trigger: daily close above $0.325 with increasing volume — raises weekly/monthly bullish odds.
- Bearish trigger: daily close below $0.245 with heavy sell volume — shifts weekly/monthly probabilities toward bearish and opens path to demand zones.
🧮 Methodology — How to Reproduce This Analysis
- Fetch live data: spot or perp price, 24h high/low, 24h volume, exchange listings via services like CoinMarketCap, CoinGecko, or TradingView.
- Baseline technical sentiment: reference TradingView’s “technicals” or indicator stacks (MA, RSI, MACD, etc.) to set neutral / buy/sell context.
- Define thresholds for price-range buckets: daily, weekly, monthly (±3%, ±10%, ±25% — adaptable to asset volatility).
- Identify zones: mark consolidation bases before big moves → demand zones; mark swing-high clusters/rejection points → supply zones. Confirm with volume spikes or order-book liquidity pockets. (Cointelegraph)
- Assign baseline probabilities: start with a neutral-biased spread (e.g., neutral 45%, bullish 30%, bearish 25%) when baseline conditions are neutral. Then adjust based on: price’s proximity to zones, volume strength, liquidity, and presence of leveraged or derivatives markets.
- Recompute probabilities any time a major event (listing, social catalyst, big volume spike, exchange news) happens or if price decisively breaks a zone.
⚠️ Risk & Trade-Management Notes
- FARTCOIN is a high-volatility meme token — treat position sizing cautiously and use strict risk controls.
- Derivatives / perpetuals amplify moves: large gains or losses can happen quickly — avoid excessive leverage if risk tolerance is low.
- This model is dynamic: recompute whenever there’s a big move, major news, or significant change in volume/liquidity — previous probabilities may no longer hold.
📝 Disclaimer (IMPORTANT)
This analysis is educational and informational only. It does not constitute financial, investment, or trading advice. Do not interpret it as an endorsement or recommendation to buy, sell, or hold FARTCOIN (or any asset). Always do your own research, evaluate your personal risk tolerance, and — if needed — consult a licensed financial advisor before making investment decisions.
📢 Why You Should Follow One Web One Hub
FARTCOINUSDT Nov 27 2025 FI With Referral Link
At One Web One Hub, our goal is to provide clear, reproducible frameworks — not hype. Every post includes:
- Multi-timeframe price-range probabilities
- Transparent methodology so you can run your own analysis
- Clearly defined demand & supply zones and key levels to watch
- Risk management notes to protect your capital
Bookmark this analysis, subscribe for daily updates, share with your community, and build your own disciplined trading/analysis habit. Let’s grow smarter, not noise-driven.


