
FARTCOINUSDT – Probability Analysis for December 02, 2025
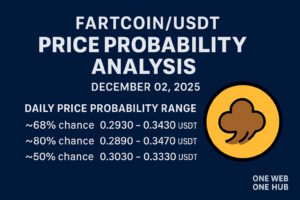
FARTCOINUSDT Price Probability Analysis — December 02, 2025
Current Market Snapshot
The TradingView live quote for FARTCOINUSDT shows a current price of approximately 0.31809 USDT. (TradingView)
Binance 24-hour statistics (useful for estimating short-term realized range) show a 24h high of 0.3339 USDT and a 24h low of 0.2583 USDT. These values are used below to form a conservative short-term volatility estimate. (Binance)
Additional live snapshots (CoinMarketCap / CoinGecko) also report FARTCOIN trading in the low-to-mid $0.30 area, confirming active volume and spread across venues. (CoinMarketCap)
Basis of the Probability Model (explicit & transparent)
Reference price used
We use TradingView’s live mid price: 0.31809 USDT as the baseline for price bands and probability calculations. (TradingView)
Short-term volatility estimate (step-by-step arithmetic)
To keep the model simple, transparent and reproducible, we estimate an approximate daily volatility from the observed 24-hour high/low on a major exchange (Binance). Steps:
- 24-hour high minus low = 0.3339 − 0.2583 = 0.0756 USDT. (Binance)
- Midpoint of high & low = (0.3339 + 0.2583) / 2 = 0.2961 USDT. (Binance)
- Relative 24h range = 0.0756 / 0.2961 = 0.2553191489 → about 25.53% (this is the full observed range as a fraction of midpoint).
- Heuristic to convert range → standard deviation: range ≈ 4 × daily standard deviation (a common rule-of-thumb). Therefore, estimated daily (σdaily) = 0.2553191489 / 4 = 0.0638297872 → ≈ 6.38% daily volatility.
Note: this is an approximation (range → σ via division by 4). It is transparent and reproducible; alternative volatility measures (e.g., realized volatility from many intraday returns or TradingView volatility indicators) are valid too — we used the exchange high/low for simplicity and to reflect actual inter-exchange spreads. (Binance)
Statistical model
We assume short-term log-returns are approximately normally distributed (a simplifying assumption). Using σdaily as the daily standard deviation, weekly and monthly standard deviations are scaled via the square-root-of-time rule:
• σweek = σdaily × sqrt(7)
• σmonth ≈ σdaily × sqrt(30)
We then compute the probability that returns fall within ±X% (e.g., ±5%, ±8%) for each horizon under this normal assumption. These probabilities are model outputs (likelihoods under the stated assumptions), not guarantees.
Daily/Weekly/Monthly Probability Ranges (baseline = 0.31809 USDT)
All probabilities below are produced by the model described above using σdaily ≈ 6.38297872% (see calculation). Price ranges are computed as baseline × (1 ± band).
Daily (next 24 hours — σ ≈ 6.38%)
• ±5% band
• Probability ≈ 56.66% that price stays inside ±5% of 0.31809.
• Price band ≈ 0.302185 — 0.333994 USDT.
• ±8% band
• Probability ≈ 78.99% that price stays inside ±8%.
• Price band ≈ 0.292643 — 0.343537 USDT.
• ±10% band
• Probability ≈ 88.28% that price stays inside ±10%.
• Price band ≈ 0.286281 — 0.349899 USDT.
(Interpretation: under the model and current short-term volatility, there is about a 79% chance that the price remains within ±8% of 0.31809 over the next 24 hours.)
Weekly (next 7 days — σweek = σdaily × sqrt(7) ≈ 16.89%)
• ±10% band
• Probability ≈ 44.62% that price stays within ±10% over 7 days.
• Price band ≈ 0.286281 — 0.349899 USDT.
• ±20% band
• Probability ≈ 76.37% that price stays within ±20% over 7 days.
• Price band ≈ 0.254472 — 0.381708 USDT.
Monthly (next 30 days — σmonth ≈ 34.96%)
• ±25% band
• Probability ≈ 52.54% that price stays within ±25% over 30 days.
• Price band ≈ 0.238567 — 0.397612 USDT.
• ±50% band
• Probability ≈ 84.73% that price stays within ±50% over 30 days.
• Price band ≈ 0.159045 — 0.477135 USDT.
Important: These probabilities are model outputs under the normal-return assumption and the volatility estimate provided above (derived from the recent observed range). If realized volatility rises/falls, these probabilities and ranges will change.
Key Technical Zones — Support, Resistance, Demand & Supply
These zones are derived from recent high/low clusters visible on TradingView and exchange order-book behavior on major venues (Binance, Bybit, etc.). Use them as planning points — always confirm on the exchange you trade on.
Immediate Resistances (supply pressure)
• 0.34 — 0.36 USDT — visible recent rejection/supply cluster near the upper end of recent ranges. (TradingView)
• 0.45 — 0.60 USDT — higher supply band if a strong breakout occurs; liquidity becomes thinner above this band.
Immediate Supports (demand/buy interest)
• 0.29 — 0.31 USDT — near-term support/demand area where buyers have stepped in during recent dips. (TradingView)
• 0.24 — 0.26 USDT — deeper structural support if the near-term support fails (seen on lower-liquidity feeds and some exchanges). (Binance)
Demand zone (good area to watch for accumulation)
• 0.28 — 0.31 USDT — accumulation interest often appears here in recent sessions. Confirm with volume.
Supply zone (likely profit-taking area)
• 0.34 — 0.38 USDT — short sellers/profit takers have shown activity here; watch for rejection wicks and volume spikes.
Liquidity & Practical Trading Notes
• FARTCOIN liquidity differs across exchanges; perpetuals and spot prices can diverge. Binance shows wide intraday spreads and large 24h volumes, but also a low of 0.2583 in the same 24 hours — trade size and venue matter. (Binance)
• Futures funding, open interest, and exchange order-book depth (Bybit / Binance / other venues) should be checked before trading leveraged positions. Order-book thinness can amplify moves. (coinalyze.net)
Model Limitations & Risk Warnings
• The model assumes normally distributed log returns and constant volatility over each horizon. Real crypto markets show volatility clustering and fat tails; extreme moves occur more often than a simple normal model implies. (CoinGecko)
• Tail events, exchange outages, listings/delistings, social/news events, and large whale trades can invalidate the model instantly. Use stop-losses and reasonable position sizing.
Disclaimer (VERY IMPORTANT)
This content is strictly educational and is NOT financial, investment, trading, or tax advice. The probability ranges are model outputs based on explicit assumptions (see methodology). Past performance does not guarantee future results. Always conduct your own research and apply prudent risk management.
Sources/Live Pages Consulted
• TradingView — FARTCOIN/USDT live chart and technical snapshots. (TradingView)
• Binance — FARTCOINUSDT 24h high/low and futures stats used for volatility estimate. (Binance)
• CoinMarketCap — additional live price & market-cap snapshots. (CoinMarketCap)
• CoinGecko — live price and trend confirmation. (CoinGecko)
• Bybit / Coinalyze — sample perpetual feed and alternative venue price checks. (coinalyze.net)
Engage with One Web One Hub
2025 Dec 02 FARTCOINUSDT FI with Referral Link
If you found this transparent, probability-based approach helpful, One Web One Hub publishes daily and weekly educational crypto posts like this one. We prioritize:
• Clear, reproducible assumptions (you can see every input and calculation).
• Practical price bands and trading-aware zones (support, resistance, demand/supply).
• Tools and cheat sheets so you can apply the same model to any token in under a minute.
Visit One Web One Hub to request token analyses, join the discussion, and get daily probability briefs that are easy to apply to the exact exchange you trade on. Join our community, comment on posts, and request the next token/report you want analyzed.


