XRPUSDT – Probability Analysis for Jun 14, 2026
XRPUSDT Price Analysis – June 14, 2026
Live Market Overview
According to the latest XRPUSDT market data visible on TradingView and CoinMarketCap:
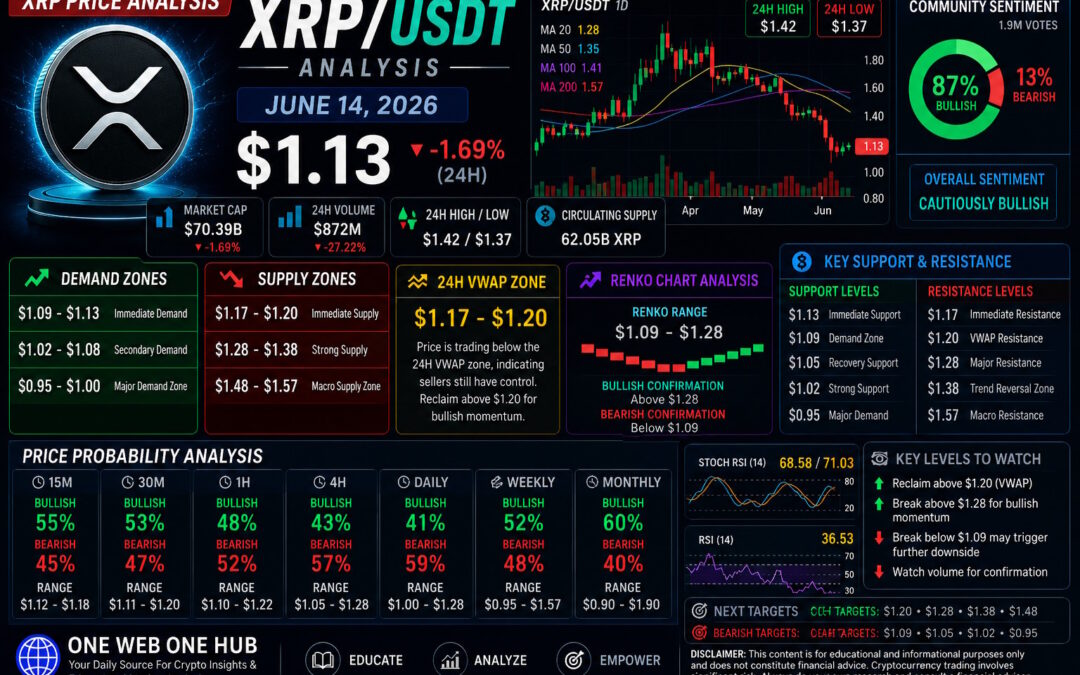
- Current XRP Price: $1.13
- 24-Hour Change: -1.69%
- Intraday High: $1.42
- Intraday Low: $1.37
- Market Capitalization: ~$70.39 Billion
- 24-Hour Volume: ~$872 Million
- RSI (14): 36.53
- Stochastic RSI: 68.58 / 71.03
- Community Sentiment: 87% Bullish / 13% Bearish
- Major Resistance Cluster: $1.20 – $1.38
- Major Support Cluster: $1.02 – $1.13
Recent market data shows XRP trading near $1.14 with a market capitalization around $70.9 billion and daily volume near $891 million. XRP remains among the largest cryptocurrencies by market capitalization. (CoinMarketCap)
Market Structure Analysis
Short-Term Trend
The market remains under pressure despite a recovery attempt from recent lows.
Key observations:
- XRP remains below all major moving averages.
- Buyers successfully defended the $1.02–$1.09 support zone.
- Recovery momentum is slowing near resistance.
- Volume remains below levels typically associated with strong bullish reversals.
Current short-term bias: Bearish-Neutral
Intermediate Trend
The 4-hour structure shows:
- Recent liquidation-driven decline.
- Oversold conditions beginning to normalize.
- Consolidation forming near support.
Current intermediate bias: Neutral-Bearish
Long-Term Trend
Long-term XRP sentiment remains constructive due to ongoing institutional interest and utility-based adoption discussions surrounding the XRP ecosystem. However, price must reclaim key resistance zones before a broader bullish trend can resume. (Reddit)
Current long-term bias: Neutral-Bullish
Demand and Supply Zones
Immediate Demand Zone
$1.09 – $1.13
Current buyer defense area.
Secondary Demand Zone
$1.02 – $1.08
Recent panic-selling recovery zone.
Major Demand Zone
$0.95 – $1.00
Psychological and institutional accumulation area.
Immediate Supply Zone
$1.17 – $1.20
Current recovery barrier.
Strong Supply Zone
$1.28 – $1.38
Major moving average resistance cluster.
Macro Supply Zone
$1.48 – $1.57
Higher-timeframe resistance region.
Support and Resistance Levels
Key Support Levels
| Support | Importance |
|---|---|
| $1.13 | Immediate Support |
| $1.09 | Demand Zone |
| $1.05 | Recovery Support |
| $1.02 | Strong Support |
| $0.95 | Major Demand |
Key Resistance Levels
| Resistance | Importance |
|---|---|
| $1.17 | Immediate Resistance |
| $1.20 | VWAP Resistance |
| $1.28 | Major Resistance |
| $1.38 | Trend Reversal Zone |
| $1.57 | Macro Resistance |
24-Hour VWAP Analysis
Estimated 24H VWAP Zone
Based on volume concentration, price acceptance areas, and intraday structure:
Estimated VWAP Zone: $1.17 – $1.20
VWAP Interpretation
Current XRP price remains below the estimated VWAP zone.
This suggests:
- Sellers maintain control.
- Recovery remains corrective.
- Buyers must reclaim $1.20 to improve momentum.
Bullish VWAP Scenario
A sustained move above:
$1.20
Could target:
- $1.28
- $1.38
- $1.48
Bearish VWAP Scenario
Failure below:
$1.13
Could target:
- $1.09
- $1.05
- $1.02
Renko Chart Analysis
Current Renko Structure
Renko charts continue showing a bearish structure despite recent stabilization.
Observations:
- Previous bearish bricks remain dominant.
- Reversal bricks have begun forming near support.
- Confirmation of trend reversal remains absent.
Renko Demand Range
$1.09 – $1.13
Current stabilization area.
Renko Supply Range
$1.17 – $1.28
Primary resistance region.
Bullish Renko Confirmation
A close above:
$1.28
Could initiate movement toward:
- $1.38
- $1.48
Bearish Renko Confirmation
A break below:
$1.09
May target:
- $1.05
- $1.00
- $0.95
Multi-Timeframe Price Probability Analysis
Basis of Probability Model
Probabilities are derived from:
- Price action structure
- RSI momentum
- Stochastic RSI positioning
- VWAP analysis
- Renko trend direction
- Volume profile analysis
- Historical XRP reactions
- Market sentiment indicators
15-Minute Timeframe
Bias
Neutral-Bullish Recovery
Probabilities
- Bullish: 55%
- Bearish: 45%
Expected Range
$1.12 – $1.18
30-Minute Timeframe
Bias
Neutral
Probabilities
- Bullish: 53%
- Bearish: 47%
Expected Range
$1.11 – $1.20
1-Hour Timeframe
Bias
Neutral-Bearish
Probabilities
- Bullish: 48%
- Bearish: 52%
Expected Range
$1.10 – $1.22
4-Hour Timeframe
Bias
Bearish
Probabilities
- Bullish: 43%
- Bearish: 57%
Expected Range
$1.05 – $1.28
Daily Timeframe
Bias
Bearish
Probabilities
- Bullish: 41%
- Bearish: 59%
Expected Range
$1.00 – $1.38
Weekly Timeframe
Bias
Neutral
Probabilities
- Bullish: 52%
- Bearish: 48%
Expected Range
$0.95 – $1.57
Monthly Timeframe
Bias
Bullish Recovery Potential
Probabilities
- Bullish: 60%
- Bearish: 40%
Expected Range
$0.90 – $1.90
Sentiment Analysis
Current Market Sentiment
Current XRP sentiment is:
Short-Term Bearish
Long-Term Constructive
Reasons include:
- Price trading below VWAP.
- RSI remains weak but recovering.
- Strong community optimism despite correction.
- Institutional utility narrative remains active. (Reddit)
Sentiment Price Ranges
Bullish Sentiment Zone
$1.20 – $1.38
Neutral Sentiment Zone
$1.09 – $1.19
Bearish Sentiment Zone
Below $1.09
Key Levels Traders Should Monitor
Bullish Signals
- Reclaim of $1.20 VWAP
- Break above $1.28
- Rising volume
- RSI moving above 50
Bearish Signals
- Loss of $1.09 support
- Falling volume during rallies
- Failure to reclaim VWAP
- Continued lower highs
Why Readers Follow One Web One Hub
Jun 14 2026 XRPUSDT (Referral Link)
Daily Cryptocurrency Market Intelligence
One Web One Hub delivers:
- XRP daily price analysis
- Bitcoin and Ethereum forecasts
- Renko chart education
- VWAP trading strategies
- Multi-timeframe probability analysis
- Trading psychology insights
- Beginner-to-advanced crypto education
Our mission is to help traders and investors understand market behavior through structured educational content rather than speculation.
Whether you are building a long-term portfolio or actively trading XRPUSDT, One Web One Hub provides actionable market insights designed to improve discipline, risk management, and market understanding.
Bookmark One Web One Hub and return daily for professional cryptocurrency analysis and educational trading content.
Educational Disclaimer
This article is intended solely for educational and informational purposes and should not be considered financial, investment, or trading advice.
Cryptocurrency markets are highly volatile and involve significant risk. Always conduct your own research, use appropriate risk management, and consult a qualified financial advisor before making investment decisions.
Previous Post XRPUSDT – Probability Analysis for Jun 07, 2026


