ETHUSDT – Probability Analysis for Jun 13, 2026
ETHUSDT Price Analysis – June 13, 2026
Current ETHUSDT Live Price
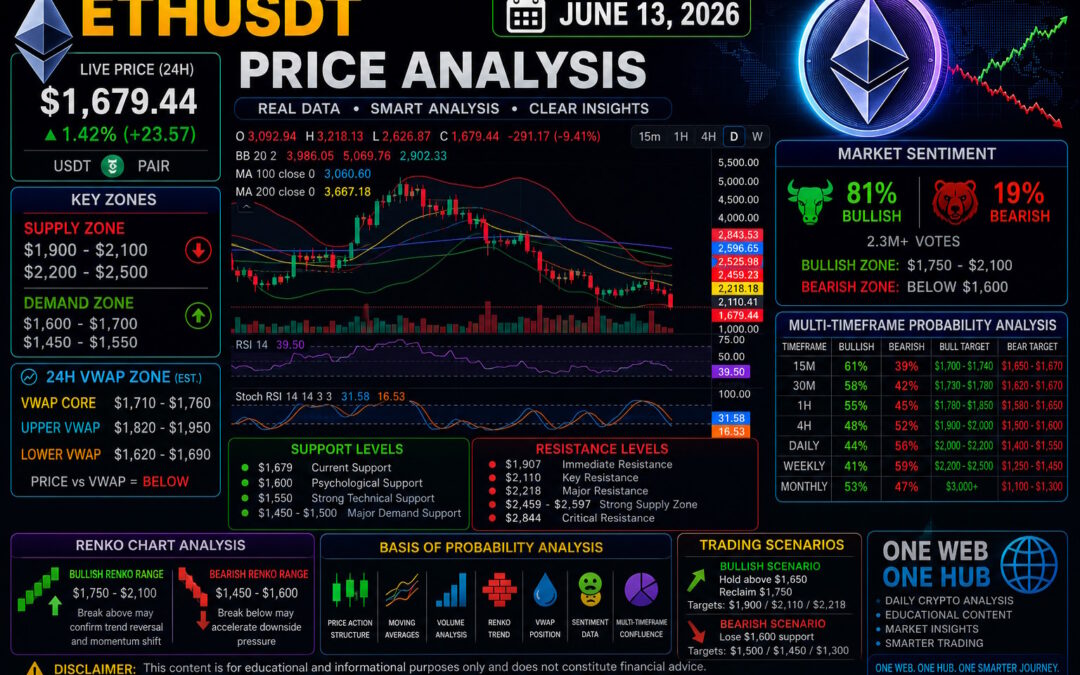
Ethereum (ETHUSDT) is trading near $1,679.44 according to the latest market snapshot. Despite posting a modest +1.42% daily gain, the broader market structure remains under pressure after a substantial correction from higher price levels.
The weekly chart continues to reflect bearish momentum, while short-term traders are attempting to establish a recovery above the $1,650-$1,700 region.
Market Overview
Ethereum Market Structure
Current ETH market conditions indicate:
- Short-term recovery attempt underway
- Weekly trend remains bearish
- Price remains below major moving averages
- Volatility remains elevated
- Institutional accumulation zones are approaching
The battle between buyers and sellers is currently centered around the $1,650-$1,700 zone.
Key Support and Resistance Levels
Immediate Support
$1,679 – Current market support
$1,600 – Psychological support
$1,550 – Strong technical support
Major Support
$1,450 – $1,500
Long-term accumulation zone.
Immediate Resistance
$1,907
$2,110
$2,218
Major Resistance
$2,459
$2,597
$2,844
Macro Resistance
$3,000 – $3,300
Demand and Supply Zones
Primary Demand Zone
$1,600 – $1,700
Current institutional demand region.
Secondary Demand Zone
$1,450 – $1,550
Major accumulation area.
Extreme Demand Zone
$1,250 – $1,450
Long-term value area.
Primary Supply Zone
$1,900 – $2,100
First significant seller concentration zone.
Secondary Supply Zone
$2,200 – $2,500
Likely profit-taking region.
Macro Supply Zone
$2,800 – $3,300
Major resistance cluster from previous distribution activity.
Estimated 24-Hour VWAP Analysis
Estimated VWAP Core Zone
$1,710 – $1,760
Upper VWAP Deviation Zone
$1,820 – $1,950
Lower VWAP Deviation Zone
$1,620 – $1,690
VWAP Interpretation
ETH remains slightly below the estimated 24-hour VWAP equilibrium.
Implications:
- Sellers maintain overall control
- Buyers are attempting recovery
- A breakout above VWAP may trigger short-covering activity
- Rejection at VWAP may restart downside pressure
Current VWAP bias remains cautiously bearish.
Renko Chart Analysis
Current Renko Structure
Renko charts continue to print bearish bricks on higher timeframes.
However, recent price stabilization around the $1,650 region suggests a potential pause in selling pressure.
Bullish Renko Range
$1,750 – $2,100
A sustained move above this range would improve trend conditions.
Bearish Renko Range
$1,450 – $1,600
Failure to hold support may trigger another downside leg.
Renko Trend Bias
Bearish with developing recovery signals.
Multi-Timeframe Probability Analysis
15-Minute Timeframe
Bullish Probability: 61%
Target Range: $1,700 – $1,740
Bearish Probability: 39%
Target Range: $1,650 – $1,670
30-Minute Timeframe
Bullish Probability: 58%
Target Range: $1,730 – $1,780
Bearish Probability: 42%
Target Range: $1,620 – $1,670
1-Hour Timeframe
Bullish Probability: 55%
Target Range: $1,780 – $1,850
Bearish Probability: 45%
Target Range: $1,580 – $1,650
4-Hour Timeframe
Bullish Probability: 48%
Target Range: $1,900 – $2,000
Bearish Probability: 52%
Target Range: $1,500 – $1,600
Daily Timeframe
Bullish Probability: 44%
Target Range: $2,000 – $2,200
Bearish Probability: 56%
Target Range: $1,400 – $1,550
Weekly Timeframe
Bullish Probability: 41%
Target Range: $2,200 – $2,500
Bearish Probability: 59%
Target Range: $1,250 – $1,450
Monthly Timeframe
Bullish Probability: 53%
Target Range: $3,000+
Bearish Probability: 47%
Target Range: $1,100 – $1,300
The monthly structure continues to suggest long-term accumulation opportunities despite short-term weakness.
Market Sentiment Analysis
Community Sentiment
Current sentiment remains heavily bullish:
Bullish: 81%
Bearish: 19%
Sentiment Price Zones
Bullish Recovery Zone
$1,750 – $2,100
Neutral Zone
$1,650 – $1,750
Bearish Continuation Zone
Below $1,600
Sentiment Interpretation
Retail traders remain optimistic despite Ethereum trading significantly below previous highs.
Historically, such sentiment can support recovery rallies but may also increase volatility if support levels fail.
Basis of Probability Analysis
Factors Included
- Price action analysis
- Weekly trend structure
- Bollinger Band positioning
- Moving average alignment
- Renko chart trend direction
- Estimated VWAP positioning
- Support and resistance levels
- Demand and supply zones
- Volume behavior
- Market sentiment data
- Multi-timeframe confluence
The probabilities presented represent scenario-based forecasting rather than guarantees.
Trading Outlook for June 2026
Bullish Scenario
Requirements:
- Hold above $1,650
- Reclaim VWAP zone
- Break above $1,750
Potential Targets:
$1,900
$2,110
$2,218
Bearish Scenario
Requirements:
- Lose $1,600 support
Potential Targets:
$1,500
$1,450
$1,300
Risk Management Considerations
Current market conditions remain highly volatile.
Traders should:
- Reduce leverage exposure
- Scale entries gradually
- Use stop-loss protection
- Avoid revenge trading
- Focus on capital preservation
Managing risk effectively remains more important than predicting every market move.
Educational Disclaimer
This article is provided for educational and informational purposes only and should not be considered financial, investment, or trading advice.
Cryptocurrency markets are highly volatile and involve substantial risk. Always conduct your own research and consult a licensed financial professional before making investment decisions.
One Web One Hub – Your Daily Crypto Market Intelligence Center
13 Jun 2026 ETHUSDT FI (Referral Link)
Why Traders Follow One Web One Hub
- Daily Ethereum and Bitcoin analysis
- Multi-timeframe probability forecasting
- Renko chart education
- VWAP-based market insights
- Demand and supply zone identification
- Risk management strategies
- Market sentiment tracking
Stay Ahead of the Crypto Market
The cryptocurrency market rewards preparation, discipline, and continuous learning.
At One Web One Hub, our mission is to provide educational content that helps traders understand market structure, improve decision-making, and navigate volatility with confidence.
Whether Ethereum is rallying, consolidating, or correcting, One Web One Hub delivers the analysis and insights needed to stay informed.
One Web. One Hub. One Smarter Crypto Journey.
Previous Post ETHUSDT – Probability Analysis for Jun 06, 2026


