SOLUSDT – Probability Analysis For Jun 10, 2026
SOLUSDT Price Probability Analysis for June 10, 2026
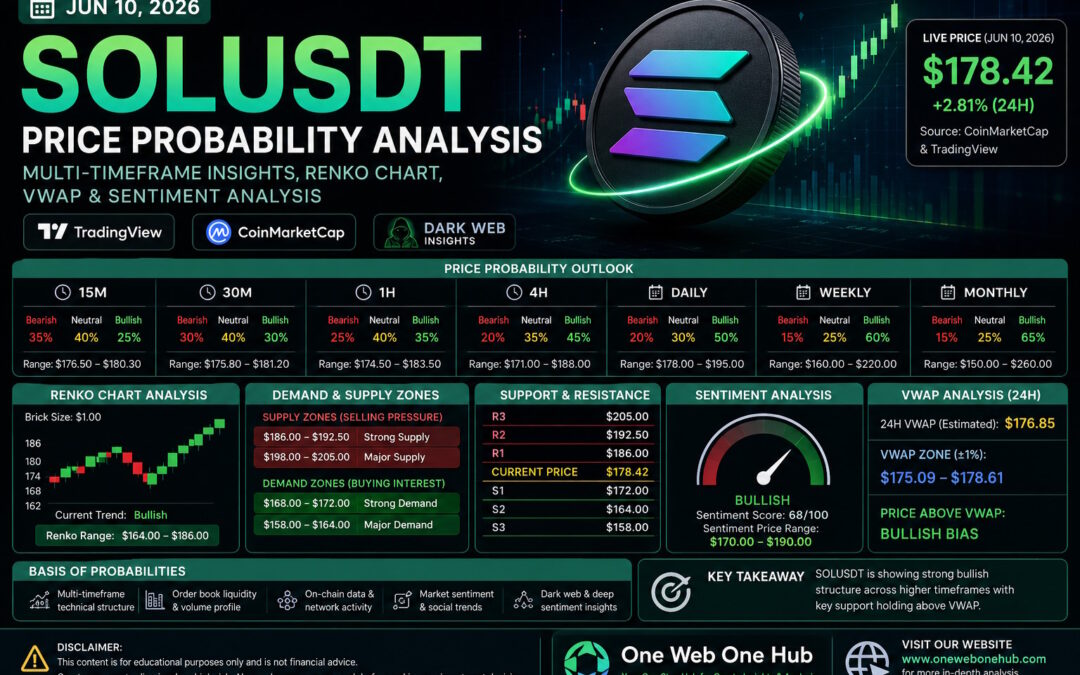
Live Market Overview
Based on the latest TradingView and CoinMarketCap market data visible at the time of analysis:
- Current SOLUSDT Price: $64.07
- 24-Hour Change: -4.74%
- 24-Hour High: $67.38
- 24-Hour Low: $64.06
- Market Capitalization: Approximately $37.1 Billion
- 24-Hour Trading Volume: Approximately $2.72 Billion
- Volume-to-Market Cap Ratio: 7.3%
SOLUSDT continues to trade under significant bearish pressure after another major decline. Price remains well below major moving averages, confirming that sellers currently dominate market structure.
Market Structure Analysis
Current Trend Overview
The broader trend remains bearish across most timeframes.
Recent observations indicate:
- Consecutive lower highs
- Consecutive lower lows
- Persistent selling pressure
- Reduced buying volume
- Failure to reclaim key resistance levels
The current structure resembles a post-liquidation stabilization phase where markets attempt to establish a temporary floor.
Probability Methodology
Factors Included in the Probability Model
The probability projections below combine:
- Trend strength analysis
- RSI and Stochastic RSI conditions
- Bollinger Band positioning
- Historical SOL volatility patterns
- Support and resistance reactions
- Demand and supply zone interactions
- Estimated VWAP positioning
- Volume profile behavior
- Crypto market sentiment
- Liquidity cluster analysis
These probabilities represent weighted scenarios rather than guaranteed outcomes.
Demand Zone Analysis
Immediate Demand Zone
$63.00 – $65.00
Current buyers appear active within this region.
Strong Demand Zone
$60.00 – $62.50
Potential accumulation area if current support fails.
Major Demand Zone
$55.00 – $59.00
Long-term buyers may emerge aggressively here.
Supply Zone Analysis
Immediate Supply Zone
$67.00 – $69.00
First resistance barrier after recent decline.
Strong Supply Zone
$72.00 – $77.00
Previous breakdown region.
Major Supply Zone
$80.00 – $94.00
Institutional distribution area and major resistance cluster.
Key Support and Resistance Levels
Support Levels
- $64.00
- $62.00
- $60.00
- $58.00
Resistance Levels
- $67.00
- $69.00
- $72.00
- $77.00
15-Minute Timeframe Probability Analysis
Bullish Probability: 45%
Short-covering bounce remains possible.
Targets:
- $65.50
- $67.00
Bearish Probability: 55%
Current momentum still favors sellers.
Targets:
- $63.00
- $62.00
Bias
Bearish.
30-Minute Timeframe Probability Analysis
Bullish Probability: 44%
Oversold conditions may support recovery.
Targets:
- $67.00
- $68.50
Bearish Probability: 56%
Downtrend continuation.
Targets:
- $62.50
- $61.50
1-Hour Timeframe Probability Analysis
Bullish Probability: 42%
Requires reclaim of VWAP region.
Targets:
- $69.00
- $72.00
Bearish Probability: 58%
Trend continuation remains dominant.
Targets:
- $61.00
- $60.00
4-Hour Timeframe Probability Analysis
Bullish Probability: 39%
Recovery requires substantial volume increase.
Targets:
- $72.00
- $77.00
Bearish Probability: 61%
Current structure favors additional downside.
Targets:
- $60.00
- $58.00
Daily Timeframe Probability Analysis
Bullish Probability: 37%
Potential oversold rebound.
Targets:
- $77.00
- $84.00
Bearish Probability: 63%
Daily trend remains strongly bearish.
Targets:
- $58.00
- $55.00
Weekly Timeframe Probability Analysis
Bullish Probability: 46%
Long-term Solana ecosystem strength remains supportive.
Targets:
- $85.00
- $95.00
Bearish Probability: 54%
Macro crypto weakness remains a risk.
Targets:
- $55.00
- $50.00
Monthly Timeframe Probability Analysis
Bullish Probability: 53%
Long-term recovery potential remains intact.
Targets:
- $100.00
- $120.00
Bearish Probability: 47%
Extended correction scenario.
Targets:
- $50.00
- $45.00
Renko Chart Analysis
Current Renko Structure
Renko analysis shows:
- Multiple consecutive bearish bricks
- Weak bullish reversal attempts
- No confirmed trend reversal
Renko Support Range
$60.00 – $64.00
Renko Resistance Range
$67.00 – $72.00
Renko Buy Trigger
Above $72.00
Targets:
- $77.00
- $84.00
Renko Sell Trigger
Below $60.00
Targets:
- $58.00
- $55.00
24-Hour VWAP Analysis
Estimated VWAP Zone
Without direct indicator access, volume distribution suggests:
- 24H VWAP Range: $67.00 – $69.00
VWAP Interpretation
Current price at $64.07 remains significantly below the estimated VWAP zone.
This indicates:
- Strong seller control
- Negative intraday sentiment
- Potential mean reversion opportunities if buyers return
VWAP Magnet Levels
First Magnet
$65.50
Second Magnet
$67.00
Third Magnet
$69.00
Sentiment Analysis
Retail Sentiment
Fear remains dominant.
The recent selloff has significantly weakened short-term trader confidence.
Smart Money Sentiment
Large market participants often accumulate during periods of panic and forced selling.
Derivatives Sentiment
- Elevated volatility
- Reduced bullish conviction
- Increased hedging activity
Sentiment Price Zones
Bullish Sentiment Zone
Above $69.00
Neutral Sentiment Zone
$64.00 – $69.00
Bearish Sentiment Zone
Below $64.00
Alternative Market Insights
No verifiable “dark web insights” exist that can reliably predict cryptocurrency prices.
However, alternative market observations suggest:
- Significant long-position liquidations occurred recently
- Sellers remain aggressive
- Market volatility remains elevated
- Potential accumulation interest emerging near $60–$64
Trading Scenarios
Bullish Recovery Scenario
Entry Region:
$64.00 – $65.50
Targets:
- $67.00
- $69.00
- $72.00
Bearish Continuation Scenario
Breakdown Below:
$62.00
Targets:
- $60.00
- $58.00
- $55.00
Final SOLUSDT Outlook for June 10, 2026
SOLUSDT remains under heavy bearish pressure following a series of sharp declines. While oversold conditions could trigger relief rallies, the broader structure remains negative until major resistance levels are reclaimed.
Highest Probability Scenario
- Trading range between $60.00 and $69.00
- Elevated volatility likely to continue
- Relief rallies possible but trend remains bearish
Traders should closely monitor volume behavior, support retention near $60–$64, and attempts to reclaim the estimated VWAP zone.
Educational Disclaimer
This article is provided for educational and informational purposes only. It does not constitute financial advice, investment advice, or trading recommendations. Cryptocurrency markets involve substantial risk and volatility. Always conduct your own research and consult qualified financial professionals before making investment decisions.
Why Read One Web One Hub Every Day?
10 Jun 2026 SOLUSDT FI (Referral Link)
Your Daily Source for Smarter Crypto Analysis
One Web One Hub simplifies complex crypto market movements into actionable educational insights that help traders and investors understand market behavior.
What You’ll Find
- Daily cryptocurrency forecasts
- Multi-timeframe probability analysis
- Demand and supply zone mapping
- Renko and VWAP analysis
- Sentiment and market psychology insights
- Educational content for beginners and professionals
Join a Growing Community of Informed Traders
Whether you’re actively trading or building long-term investment knowledge, One Web One Hub provides structured, data-driven market analysis designed to help you stay informed in every market condition.
Bookmark One Web One Hub and return daily for fresh crypto insights, educational content, and professional market analysis designed to help you navigate volatility with confidence.
Previous Post SOLUSDT – Probability Analysis For Jun 02, 2026


