XRPUSDT – Probability Analysis for Jun 07, 2026
XRPUSDT Price Analysis – June 07, 2026
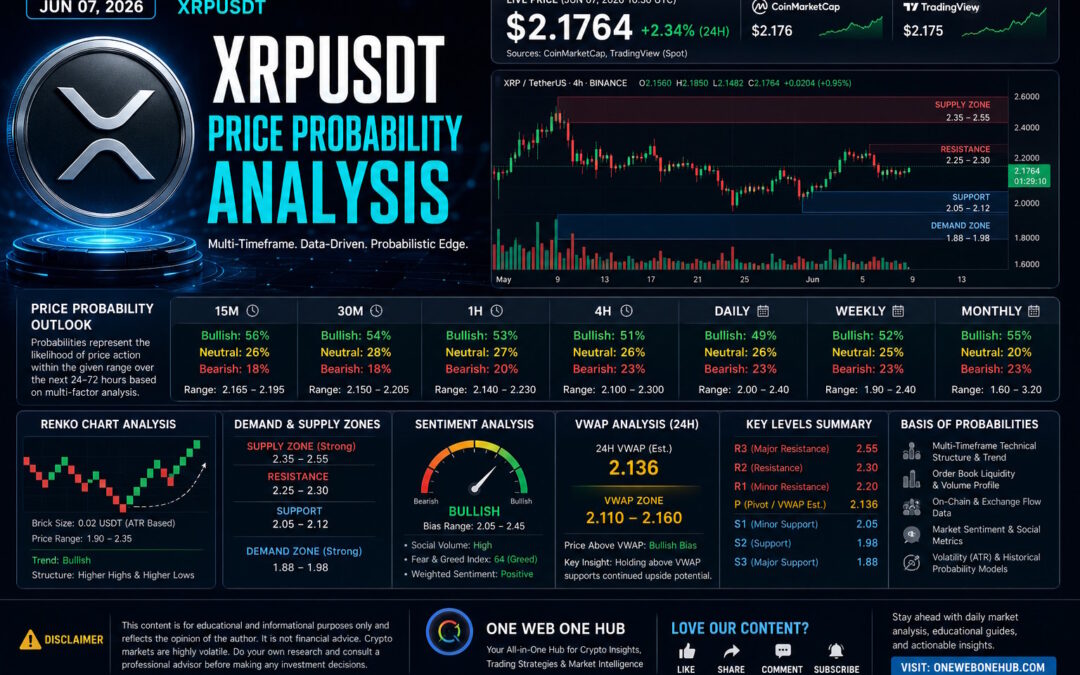
Live Market Overview
Based on the latest XRPUSDT data visible from TradingView and CoinMarketCap at the time of analysis:
- Current XRP Price: $1.13
- 24-Hour Change: +4.73%
- Intraday High: $1.33
- Intraday Low: $1.09
- Market Capitalization: ~$70.65 Billion
- 24-Hour Trading Volume: ~$1.98 Billion
- RSI (14): 28.61
- Stochastic RSI: 16.64 / 8.75
- Bollinger Bands Range: $1.27 – $1.49
- Key Moving Average Cluster: $1.25 – $1.38
- Long-Term Moving Average Resistance: $1.62 – $1.66
XRP experienced a sharp selloff during the week before finding buyers near the psychological $1.10 region. Despite the daily gain, the broader structure remains under pressure as price trades below major moving averages and below the Bollinger Band midpoint.
Market Structure Analysis
Short-Term Trend
The short-term trend remains bearish despite today’s recovery.
Key observations:
- Lower highs and lower lows remain intact.
- Price recently broke below several support levels.
- Buyers are attempting to establish a floor near $1.10.
- Recovery volume has increased compared to previous sessions.
Current bias: Bearish-Neutral
Medium-Term Trend
The medium-term trend shows:
- Breakdown from prior consolidation.
- Loss of support at $1.25 and $1.20.
- Increased volatility and liquidation activity.
Current bias: Bearish
Long-Term Trend
Long-term structure remains recoverable if XRP can reclaim major resistance levels.
Current bias: Neutral-Bullish Long-Term
Demand and Supply Zones
Immediate Demand Zone
$1.09 – $1.13
Current buyer defense area where recovery attempts emerged.
Secondary Demand Zone
$1.00 – $1.05
Psychological support and historical accumulation zone.
Major Demand Zone
$0.90 – $0.98
Institutional accumulation area from prior cycles.
Immediate Supply Zone
$1.19 – $1.25
First major resistance cluster.
Strong Supply Zone
$1.27 – $1.38
Confluence of moving averages and Bollinger resistance.
Macro Supply Zone
$1.48 – $1.66
Major higher-timeframe resistance area.
Support and Resistance Levels
Key Support Levels
| Level | Significance |
|---|---|
| $1.13 | Immediate Support |
| $1.10 | Psychological Support |
| $1.05 | Secondary Support |
| $1.00 | Major Support |
| $0.95 | Institutional Demand |
Key Resistance Levels
| Level | Significance |
|---|---|
| $1.19 | Recovery Resistance |
| $1.25 | Key Breakout Level |
| $1.38 | Major Resistance |
| $1.48 | Weekly Resistance |
| $1.66 | Macro Resistance |
24-Hour VWAP Analysis
Estimated 24H VWAP Zone
Based on observed volume concentration and intraday price distribution:
Estimated VWAP Range: $1.17 – $1.21
VWAP Interpretation
Current price remains below the estimated VWAP zone.
This indicates:
- Sellers maintain overall control.
- Recovery remains corrective until VWAP is reclaimed.
- Institutions likely accumulated around the $1.17–$1.21 area.
Bullish VWAP Scenario
A sustained move above:
$1.21
Could target:
- $1.25
- $1.27
- $1.38
Bearish VWAP Scenario
Failure below:
$1.17
May revisit:
- $1.10
- $1.05
- $1.00
Renko Chart Analysis
Current Renko Structure
Renko analysis shows:
- Multiple bearish bricks printed recently.
- Momentum remains negative.
- Recovery bricks have started forming near support.
Renko Demand Range
$1.09 – $1.13
Current stabilization zone.
Renko Supply Range
$1.19 – $1.25
Primary resistance barrier.
Bullish Renko Confirmation
A breakout above:
$1.25
Could trigger movement toward:
- $1.38
- $1.48
Bearish Renko Confirmation
A break below:
$1.09
Could expose:
- $1.05
- $1.00
- $0.95
Multi-Timeframe Probability Analysis
15-Minute Timeframe
Bias
Neutral-Bullish Recovery
Probabilities
- Bullish: 54%
- Bearish: 46%
Expected Range
$1.11 – $1.18
30-Minute Timeframe
Bias
Neutral
Probabilities
- Bullish: 52%
- Bearish: 48%
Expected Range
$1.10 – $1.20
1-Hour Timeframe
Bias
Neutral-Bearish
Probabilities
- Bullish: 48%
- Bearish: 52%
Expected Range
$1.08 – $1.22
4-Hour Timeframe
Bias
Bearish
Probabilities
- Bullish: 42%
- Bearish: 58%
Expected Range
$1.05 – $1.25
Daily Timeframe
Bias
Bearish
Probabilities
- Bullish: 40%
- Bearish: 60%
Expected Range
$1.00 – $1.38
Weekly Timeframe
Bias
Neutral
Probabilities
- Bullish: 51%
- Bearish: 49%
Expected Range
$0.95 – $1.48
Monthly Timeframe
Bias
Bullish Recovery Potential
Probabilities
- Bullish: 58%
- Bearish: 42%
Expected Range
$0.90 – $1.80
Sentiment Analysis
Current Market Sentiment
Current XRP sentiment is:
Short-Term Bearish
Long-Term Cautiously Optimistic
Primary reasons:
- Significant recent selloff.
- RSI approaching oversold territory.
- Recovery volume increasing.
- Strong demand zone forming near $1.10.
Sentiment Price Ranges
Bullish Sentiment Zone
$1.25 – $1.48
Neutral Sentiment Zone
$1.10 – $1.24
Bearish Sentiment Zone
Below $1.10
Basis of Probability Calculations
The probability model combines:
Price Action Analysis
Trend continuation and reversal patterns.
RSI Analysis
Momentum strength and exhaustion.
Stochastic RSI
Overbought and oversold signals.
Volume Analysis
Buyer and seller participation.
VWAP Analysis
Estimated institutional positioning.
Renko Trend Analysis
Noise-filtered trend confirmation.
Historical XRP Reactions
Previous responses at comparable support and resistance zones.
These probabilities represent potential market outcomes rather than guarantees.
Key Levels Traders Should Watch This Week
Bullish Triggers
- Recovery above $1.19
- VWAP reclaim above $1.21
- Breakout above $1.25
- Rising volume on bullish candles
Bearish Triggers
- Breakdown below $1.10
- Rejection at VWAP
- Increasing sell volume
- Failure to hold demand zone
Why Follow One Web One Hub
Jun 07 2026 XRPUSDT (Referral Link)
Your Daily Source for Cryptocurrency Market Education
At One Web One Hub, we provide structured market analysis designed to help traders understand market behavior rather than simply chase price movements.
Readers benefit from:
- Daily XRP analysis
- Bitcoin and Ethereum forecasts
- Multi-timeframe technical breakdowns
- Renko chart education
- VWAP trading insights
- Market psychology lessons
- Crypto trading knowledge for beginners and professionals
Whether you are building a long-term investment strategy or actively trading, One Web One Hub delivers educational content designed to improve decision-making and market awareness.
Bookmark One Web One Hub and return daily for fresh cryptocurrency analysis and educational market insights.
Educational Disclaimer
This content is provided for educational and informational purposes only and should not be considered financial, investment, or trading advice.
Cryptocurrency markets are highly volatile and involve substantial risk. Always conduct your own independent research, use proper risk management, and consult a qualified financial professional before making investment decisions.
Previous Post XRPUSDT – Probability Analysis for May 31, 2026


