ETHUSDT – Probability Analysis for May 23, 2026
ETHUSDT Price Analysis – May 23, 2026
Current ETHUSDT Live Price
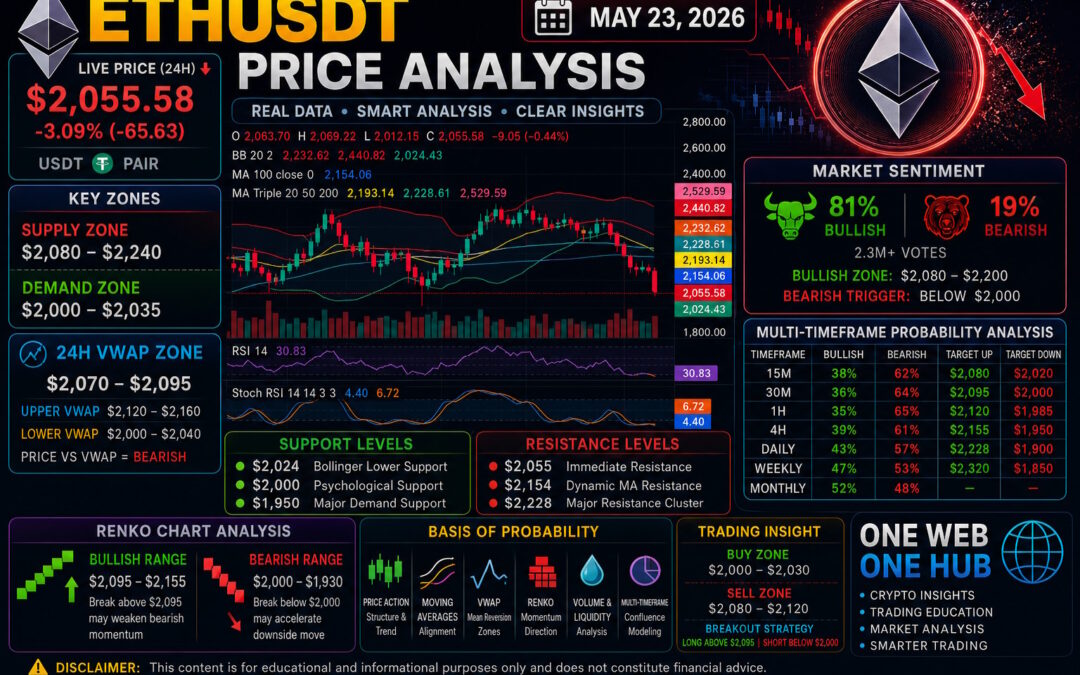
According to the latest market snapshot from CoinMarketCap, Ethereum (ETHUSDT) is trading near $2,055.58, recording a sharp -3.09% decline over the last 24 hours.
Ethereum is currently under strong bearish pressure after failing to hold above key moving average support levels, while volatility and liquidation activity continue increasing across the crypto market.
Market Structure Overview
Short-Term Structure
Ethereum currently shows:
Strong rejection from the $2,230 region
Breakdown below short-term VWAP equilibrium
Increased selling volume near local lows
This structure indicates bearish continuation risk with oversold intraday conditions developing.
Higher Timeframe Context
ETH remains inside a broader macro range:
$1,950 – $2,450
Price is now approaching critical lower demand territory where buyers may attempt stabilization.
Key Support and Resistance Levels
Immediate Support
$2,024 – Bollinger lower support
$2,000 – Psychological support
$1,950 – Macro demand support
Major Resistance
$2,055 – Immediate resistance reclaim zone
$2,154 – Dynamic moving average resistance
$2,228 – Major resistance cluster
Demand and Supply Zones
Demand Zones
Primary Demand
$2,000 – $2,035
Secondary Demand
$1,950 – $1,985
Macro Demand
$1,880 – $1,930
These zones may attract accumulation if panic selling slows.
Supply Zones
Primary Supply
$2,080 – $2,155
Secondary Supply
$2,190 – $2,240
Macro Supply
$2,320 – $2,450
These levels remain major recovery barriers for bullish continuation.
Estimated 24H VWAP Analysis
VWAP Core Zone
$2,070 – $2,095
Upper VWAP Deviation
$2,120 – $2,160
Lower VWAP Deviation
$2,000 – $2,040
VWAP Insight
ETH is trading significantly below the estimated VWAP equilibrium zone.
Above VWAP = bullish recovery potential
Below VWAP = bearish intraday dominance
Current structure strongly favors sellers unless ETH quickly reclaims the VWAP core region.
Renko Chart Analysis
Current Renko Structure
Renko bricks continue printing aggressive bearish continuation patterns after support breakdown confirmation.
Bullish Renko Range
$2,095 – $2,155
Recovery above this range may weaken bearish momentum.
Bearish Renko Range
$2,000 – $1,930
Break below $2,000 could accelerate downside momentum toward macro support zones.
Multi-Timeframe Price Probability Analysis
15-Minute Timeframe
Bullish → 38% (Target: $2,080)
Bearish → 62% (Target: $2,020)
30-Minute Timeframe
Bullish → 36% (Target: $2,095)
Bearish → 64% (Target: $2,000)
1-Hour Timeframe
Bullish → 35% (Target: $2,120)
Bearish → 65% (Target: $1,985)
4-Hour Timeframe
Bullish → 39% (Target: $2,155)
Bearish → 61% (Target: $1,950)
Daily Timeframe
Bullish → 43% (Target: $2,228)
Bearish → 57% (Target: $1,900)
Weekly Timeframe
Bullish → 47% (Target: $2,320)
Bearish → 53% (Target: $1,850)
Monthly Timeframe
Bullish → 52%
Bearish → 48%
Long-term macro structure remains neutral while ETH trades above historical accumulation zones.
Market Sentiment Analysis
Sentiment Snapshot
Community sentiment visible on CoinMarketCap currently shows:
81% Bullish
19% Bearish
Sentiment Price Range
Bullish Recovery Zone
$2,080 – $2,200
Bearish Continuation Zone
Below $2,000
Current Interpretation
Retail traders remain surprisingly bullish despite the recent decline, suggesting traders are still expecting a recovery bounce from major support.
Basis of Probability Methodology
This analysis combines:
Price action structure
VWAP equilibrium modeling
Renko trend momentum
Volume and volatility behavior
Support and resistance reactions
Supply and demand liquidity zones
Multi-timeframe technical confluence
The probabilities reflect scenario forecasting, not guaranteed outcomes.
Trading Insight
Intraday Strategy
Buy Zone
$2,000 – $2,030
Sell Zone
$2,080 – $2,120
Breakout Strategy
Long above $2,095
Short below $2,000
Risk Management Insight
During high-volatility conditions, traders should:
Reduce leverage exposure
Avoid emotional entries
Use stop-loss protection
Wait for confirmation before breakout trades
Preserving capital during uncertain conditions is critical for long-term trading survival.
Educational Disclaimer
This content is for educational and informational purposes only and should not be considered financial advice.
Cryptocurrency trading involves substantial risk and volatility. Always conduct your own research and consult a licensed financial advisor before making investment decisions.
One Web One Hub – Your Daily Crypto Intelligence Platform

23 May 2026 ETHUSDT FI (Referral Link)
At One Web One Hub, we provide educational crypto analysis designed to help traders understand market structure, sentiment, and probability-driven opportunities.
What You’ll Get
Daily ETH and BTC technical analysis
Probability-based trade scenarios
VWAP and Renko chart insights
Risk management education
Beginner-friendly market breakdowns
Whether markets are bullish or bearish, One Web One Hub helps you stay informed and prepared.
One Web. One Hub. One smarter crypto journey.
Previous Post ETHUSDT – Probability Analysis for May 16, 2026


