ETHUSDT – Probability Analysis for May 16, 2026
ETHUSDT Price Analysis – May 16, 2026
Current ETHUSDT Live Price
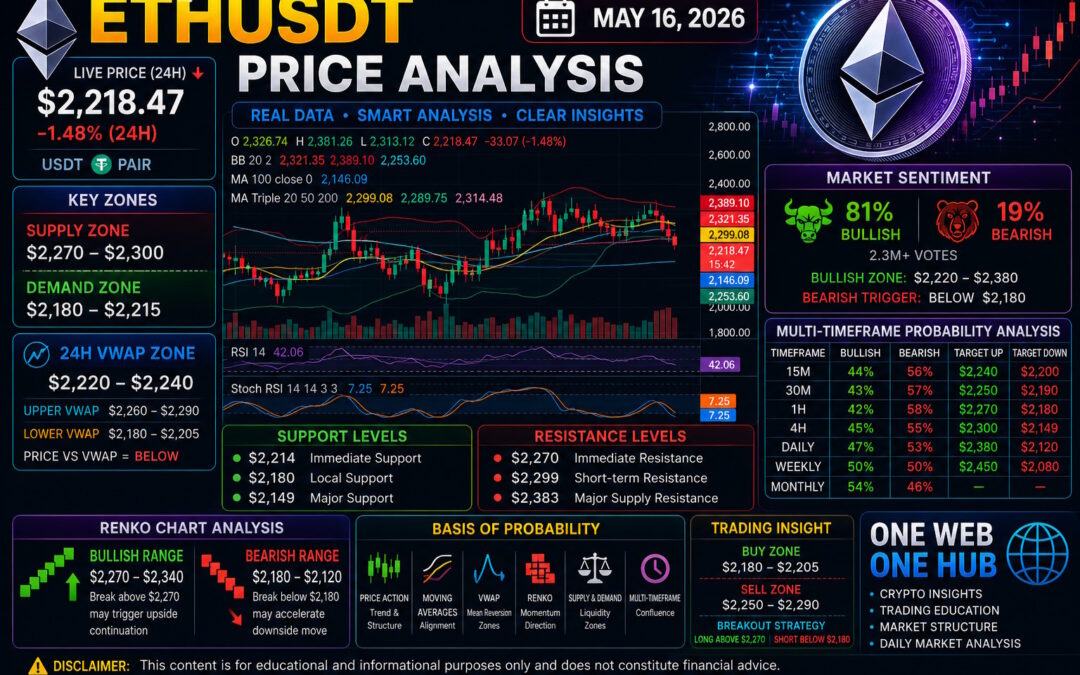
According to the latest market snapshot from CoinMarketCap, Ethereum (ETHUSDT) is trading near $2,218.47, showing a -1.48% decline over the last 24 hours.
ETH is currently facing short-term bearish pressure after failing to maintain momentum above key resistance levels, while traders closely monitor whether major support zones can hold.
Market Structure Overview
Short-Term Structure
Ethereum currently shows:
Lower highs forming near $2,380
Weakening momentum below $2,270
Selling pressure increasing near VWAP rejection zones
This structure suggests short-term bearish continuation risk inside a larger consolidation range.
Higher Timeframe Context
ETH remains inside a macro range:
$2,100 – $2,450
Price is now approaching the lower-middle portion of the range, where buyers may attempt recovery.
Key Support and Resistance Levels
Immediate Support
$2,214 – Dynamic support
$2,180 – Local support zone
$2,149 – Major support area
Major Resistance
$2,270 – Immediate resistance
$2,299 – Short-term resistance
$2,383 – Major supply resistance
Demand and Supply Zones
Demand Zones
Primary Demand
$2,180 – $2,215
Secondary Demand
$2,140 – $2,170
Macro Demand
$2,080 – $2,120
These areas may attract aggressive dip buyers if bearish pressure slows.
Supply Zones
Primary Supply
$2,270 – $2,300
Secondary Supply
$2,330 – $2,390
Macro Supply
$2,450 – $2,560
These zones remain key rejection areas unless strong bullish momentum returns.
Estimated 24H VWAP Analysis
VWAP Core Zone
$2,220 – $2,240
Upper VWAP Deviation
$2,260 – $2,290
Lower VWAP Deviation
$2,180 – $2,205
VWAP Insight
ETH is currently trading slightly below the estimated VWAP equilibrium zone.
Above VWAP = bullish recovery bias
Below VWAP = bearish intraday control
Current structure indicates sellers still maintain slight short-term control.
Renko Chart Analysis
Current Renko Structure
Renko bricks continue printing weak bearish continuation patterns after recent rejection near higher resistance.
Bullish Renko Range
$2,270 – $2,340
Break above $2,270 may invalidate short-term bearish momentum.
Bearish Renko Range
$2,180 – $2,120
Break below $2,180 may accelerate downside movement toward macro demand.
Multi-Timeframe Price Probability Analysis
15-Minute Timeframe
Bullish → 44% (Target: $2,240)
Bearish → 56% (Target: $2,200)
30-Minute Timeframe
Bullish → 43% (Target: $2,250)
Bearish → 57% (Target: $2,190)
1-Hour Timeframe
Bullish → 42% (Target: $2,270)
Bearish → 58% (Target: $2,180)
4-Hour Timeframe
Bullish → 45% (Target: $2,300)
Bearish → 55% (Target: $2,149)
Daily Timeframe
Bullish → 47% (Target: $2,380)
Bearish → 53% (Target: $2,120)
Weekly Timeframe
Bullish → 50% (Target: $2,450)
Bearish → 50% (Target: $2,080)
Monthly Timeframe
Bullish → 54%
Bearish → 46%
Long-term structure remains neutral-to-bullish while macro higher lows continue holding.
Market Sentiment Analysis
Sentiment Snapshot
Community sentiment visible on CoinMarketCap currently shows:
81% Bullish
19% Bearish
Sentiment Price Range
Bullish Sentiment Zone
$2,220 – $2,380
Bearish Trigger Zone
Below $2,180
Current Interpretation
Retail traders remain optimistic despite recent weakness, indicating confidence in Ethereum’s broader recovery structure.
Basis of Probability Methodology
This analysis integrates:
Price action trend analysis
Moving average positioning
VWAP equilibrium estimation
Renko momentum confirmation
Supply and demand liquidity zones
Multi-timeframe confluence
The objective is to create probability-based scenarios instead of unrealistic fixed predictions.
Trading Insight
Intraday Strategy
Buy Zone
$2,180 – $2,205
Sell Zone
$2,250 – $2,290
Breakout Strategy
Long above $2,270
Short below $2,180
Educational Disclaimer
This content is for educational and informational purposes only and should not be considered financial advice.
Cryptocurrency trading involves substantial risk and volatility. Always perform your own research and consult a qualified financial advisor before making investment decisions.
One Web One Hub – Your Daily Crypto Knowledge Hub

16 May 2026 ETHUSDT FI (Referral Link)
At One Web One Hub, we transform complicated market movements into practical educational insights designed for traders and investors.
What You’ll Discover
Daily ETH and BTC analysis
Probability-based trading strategies
Market structure breakdowns
Risk management and psychology insights
Whether you are a beginner or experienced trader, One Web One Hub helps you stay informed and disciplined in fast-moving crypto markets.
One Web. One Hub. One smarter way to trade.
Previous Post ETHUSDT – Probability Analysis for May 09, 2026


