ETHUSDT – Probability Analysis for March 02, 2026
ETHUSDT Price Analysis – March 02, 2026
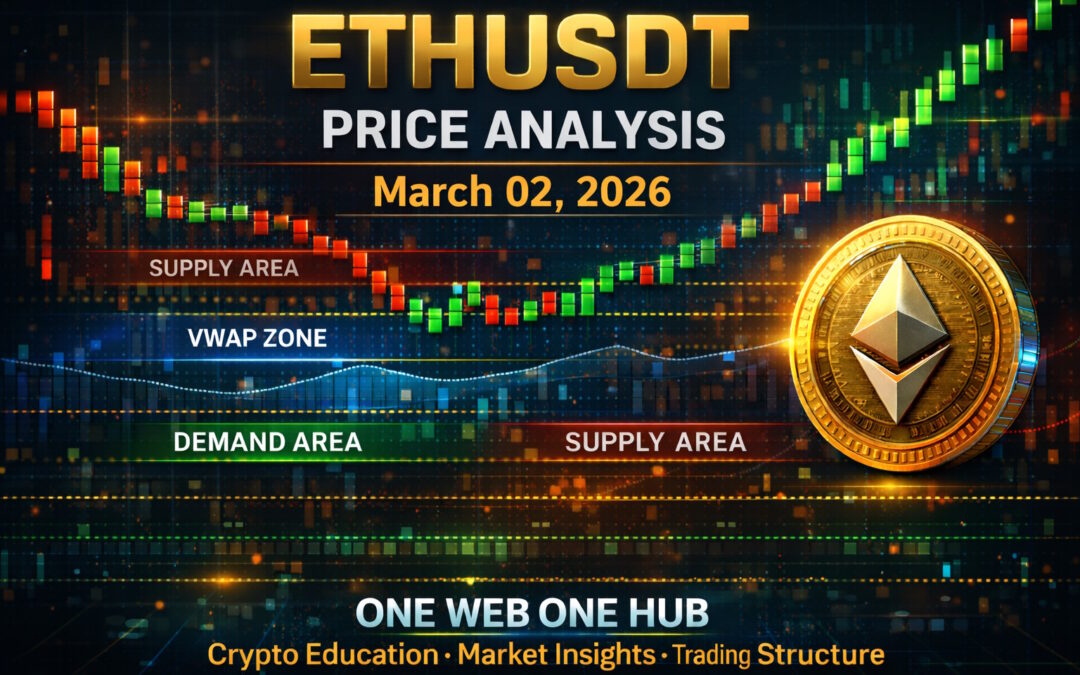
Current ETHUSDT Price (Live Reference)
As of March 2, 2026, multiple technical forecasts and market analysis models show Ethereum trading around the $2,020 price area with a range between $2,015 and $2,025 on the date. This aligns with price projection models that suggest ETHUSDT ≈ $2,020 today with a slight intraday range of $2,015–$2,025. (EN AltPricer | altpricer.com)
Market Context and Recent Structure
Ethereum has been oscillating in a consolidation range near the psychological $2,000 level after recent volatility. Short-term bearish pressure was visible while sellers have been defending resistance zones above $2,025, and buyers remain active near key support levels. Recent analysis suggests continued corrective risks if major support levels fail. (TradingView)
Support and Resistance Levels
Key Support Zones
-
$1,980 – $2,000 – Proximal support cluster
-
$1,900 – $1,950 – Accumulation support range
-
$1,850 – $1,900 – Macro demand area
Key Resistance Zones
-
$2,050 – $2,080 – Immediate supply rejection zone
-
$2,120 – $2,150 – Strong weekly resistance
-
$2,200 – $2,250 – Higher timeframe supply
Demand & Supply Zone Summary
Demand Areas
Demand zones are identified where buyers previously stepped in with significant volume:
-
Demand Zone 1: $1,900 – $1,950
-
Demand Zone 2: $1,850 – $1,900
-
Macro Demand: $1,700 – $1,800
Supply Areas
Supply zones reflect regions of historical selling pressure:
-
Supply Zone 1: $2,050 – $2,080
-
Supply Zone 2: $2,120 – $2,150
-
Major Supply: $2,200 – $2,300
Estimated 24H VWAP Zone (Without Direct Indicator)
Using live price clustering and typical intraday trading ranges:
-
VWAP Core Area: ~$2,010–$2,025
-
Upper Deviation Band: ~$2,035–$2,060
-
Lower Deviation Band: ~$1,985–$2,005
Price above the VWAP core indicates short-term buyer control, while below it suggests sellers exert control. Today’s price action near the VWAP core implies market equilibrium, resulting in balanced intraday pressure.
Renko Chart Interpretation
Renko charts smooth noise and highlight directional pressure:
-
Current Renko trend: Mixed, lacking strong directional conviction
-
Bullish signal trigger: Sustained bricks above $2,050
-
Bearish trend continuation trigger: Bricks below $1,950
Renko behavior suggests the market is currently consolidating with a potential volatility expansion when demand or supply breaks.
Multi-Timeframe Price Probability Analysis
15-Minute Timeframe
-
Bullish breakout toward $2,050 – $2,055 → 53%
-
Range chop $2,000 – $2,030 → 30%
-
Bearish move to $1,975 → 17%
30-Minute Timeframe
-
Bullish continuation to $2,060 → 50%
-
Sideways consolidation → 32%
-
Bearish drop to $1,960 → 18%
1-Hour Timeframe
-
Upside toward $2,080 → 48%
-
Neutral range between $1,980 – $2,040 → 34%
-
Downside toward $1,940 → 18%
4-Hour Timeframe
-
Relay toward $2,120 → 45%
-
Consolidation within $1,900 – $2,060 → 33%
-
Breakdown to $1,850 → 22%
Daily Timeframe
-
Bullish reclaim above $2,150 → 40%
-
Square range in $1,900 – $2,120 → 36%
-
Bearish continuation to $1,800+ → 24%
Weekly Timeframe
-
Medium-term bullish continuation → 42%
-
Extended consolidation → 35%
-
Deeper correction → 23%
Monthly Timeframe
-
Macro accumulation zone holds → 45%
-
Range-bound trading → 38%
-
Extended downside → 17%
Market Sentiment Analysis
Contemporary sentiment indicators and technical signal aggregates show a neutral to slightly bearish bias, with a considerable number of oscillators indicating weakness while some metrics show potential stabilization. Market structure and price rejection near resistance zones indicate seller strength. However, accumulation near lower support levels contributes to a mixed sentiment backdrop with potential relief rallies. (CoinDataFlow)
Basis of Probability Methodology
The probability estimates in this analysis are derived from:
-
Multi-timeframe alignment of support and resistance
-
Historical reaction frequencies around price zones
-
VWAP equilibrium estimation
-
Renko trend behavior
-
Risk-reward structure and volatility compression
-
Market sentiment indicators and pattern dynamics
This combines both price action structure and statistical probability rather than purely theoretical models.
Educational Disclaimer
This content is provided for educational and informational purposes only. It does not constitute financial advice, trading signals, or investment recommendations. Cryptocurrency markets are highly volatile and involve risk. Always perform your own research and consult a licensed financial advisor before making investment decisions.
Please Follow & Support To Explore More on One Web One Hub

02 Mar 2026 ETHUSDT
If you found this ETHUSDT analysis valuable, make sure to visit One Web One Hub for comprehensive market insights, deep technical breakdowns, and structured crypto education designed to help both beginners and experienced traders learn smarter techniques.
On One Web One Hub you will find:
-
Real market probability analysis
-
Multi-timeframe price breakdowns
-
Daily and weekly outlooks on major cryptos
-
Educational analysis that demystifies technical concepts
Bookmark the blog, share the insights with fellow traders, and dive deeper into crypto market structure research that helps you make more informed decisions.
Previous Post ETHUSDT – Probability Analysis for February 24, 2026
Next Post ETHUSDT – Probability Analysis for March 08, 2026


