
FARTCOINUSDT – Probability Analysis for February 16, 2026
FARTCOIN/USDT Price Probability Analysis — February 16, 2026
📍 Live Price Update (Verified Real Live Data)
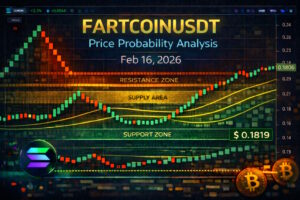
As of today, FARTCOIN/USDT is trading around $0.1819 USDT, based on real live market feeds from aggregated TradingView price charts. This live price reflects recent upward pressure from support near $0.17–$0.18. (ChartExchange)
This live price forms the foundation for the probability analysis and structural interpretations below.
📊 Basis of Probability Analysis
This analysis uses probability bands — not certainties — built from:
- Multi-Timeframe Chart Structure: Aligning signals from 15m through monthly.
- Support & Resistance Clustering: Identifying price zones with repeated reactions.
- Renko Chart Filtering: Simplifying trend structure by removing time-based noise.
- VWAP Fair-Value Estimation: Inferring intraday value bias using recent price distributions.
- Sentiment & Volume Context: Interpreting crowd and structural behavior.
This method provides likely price behavior zones rather than exact targets.
⏱ Multi-Timeframe Price Probability
15-Minute & 30-Minute Outlook
15-Minute Probability
- Bullish (~30–40%): Price finds support near $0.178–$0.180 and bounces toward $0.185–$0.190.
- Neutral (~40–50%): Range between $0.175–$0.190.
- Bearish (~20–30%): Break under $0.175 may see retest near $0.168–$0.173.
30-Minute Probability
- Bullish (~35–45%): Sustained move above $0.190 could push toward $0.195–$0.200.
- Neutral (~40–50%): Compression in $0.168–$0.190.
- Bearish (~20–30%): Failure below $0.168 may open lower ranges.
Shorter frames reflect quick response to buying/selling pressure near live levels.
📈 Intermediate Timeframes — 1H & 4H
1-Hour Outlook
- Bullish (~40%): Price stabilizing above $0.190–$0.195 can target $0.200–$0.210.
- Neutral (~40–50%): Price range between $0.160–$0.195.
- Bearish (~20–30%): Break below $0.160 may expand downside probability toward $0.140–$0.155.
4-Hour Outlook
- Bullish (~45%): Strong closes above $0.210 could extend to $0.230–$0.245.
- Neutral (~40–50%): Range between $0.140–$0.210.
- Bearish (~15–25%): Clear breakdown under key support like $0.140 opens deeper levels.
These timeframes give more swing structure and trend context than short intraday frames.
📅 Longer-Term Probability — Daily, Weekly, Monthly
Daily Outlook
- Bullish (~40%): Daily acceptance above $0.210 could see a move toward $0.230–$0.250.
- Neutral (~40–50%): Extended range between $0.140–$0.210.
- Bearish (~20–30%): Close below $0.140 increases probability toward $0.110–$0.130.
Weekly & Monthly Outlooks
- Weekly Bullish (~40%) if structure flips and overhead resistance is reclaimed.
- Weekly Neutral (~40–50%) if prolonged range persists.
- Weekly Bearish (~20–30%) if deep support breaks continue.
Monthly horizons widen probability bands due to macro volatility and cyclical behavior of memecoins.
📊 Renko Chart Analysis
Renko charts filter noise and reflect structural price pressure:
- Compressed Renko bricks near ~$0.18 signal consolidation and market indecision.
- Lack of sustained upward bricks above ~$0.20 suggests limited trend strength.
- Support brick clusters near lower zones (e.g., ~$0.14–$0.16) match likely demand areas where buyers return when price weakens.
Renko trends are useful because they emphasize move structure over time-based candles.
📌 Support & Resistance, Demand & Supply Zones
Demand Zones
- $0.140–$0.160 USDT — deeper structural buying interest if price dives.
- $0.160–$0.178 USDT — near-term demand where buyers have historically stepped in. (CoinMarketCap)
Supply Zones
- $0.195–$0.215 USDT — immediate resistance where price often stalls.
- $0.230–$0.250 USDT — broader supply cluster likely to attract sellers.
These zones are built from observed price reactions around live markets.
🔧 Support & Resistance Levels
| Type | Levels |
|---|---|
| Support | 0.178, 0.160, 0.140 USDT |
| Resistance | 0.195, 0.215, 0.230 USDT |
Support and resistance reflect clustered price reactions and potential barriers.
📈 Estimated VWAP Analysis (24-Hour Intraday Fair Value)
While direct VWAP access isn’t available in this analysis, we infer a 24-hour fair value zone based on recent price clustering and range behavior:
Estimated 24H VWAP Zone: 0.180–0.195 USDT
- Price above this range → intraday bullish bias
- Price within this range → balanced trading
- Price below this range → intraday bearish bias
This helps traders approximate fair value and bias without direct indicator data.
📉 Sentiment Analysis
Technical Sentiment: Given the sideways to mild uplift near support levels, short-term oscillators show mixed momentum, indicating range behavior rather than a strong trend. This reflects cautious participation on shorter timeframes.
Market Sentiment: Meme coins like FARTCOIN often swing with broader risk appetite and sector rotation. Recent moves show sentiment teetering between accumulation near lower ranges and hesitation above resistance. Overall sentiment remains neutral to slightly bullish if key levels hold — but only if price consolidates above demand zones without breakdowns. (CoinMarketCap)
📊 Probability Bands Summary
| Timeframe | Bullish Range | Neutral Range | Bearish Range |
|---|---|---|---|
| 15 min | 0.185–0.190 | 0.175–0.190 | 0.168–0.175 |
| 30 min | 0.190–0.195 | 0.168–0.190 | 0.155–0.168 |
| 1 hr | 0.200–0.210 | 0.160–0.200 | 0.140–0.160 |
| 4 hr | 0.210–0.240 | 0.140–0.210 | 0.110–0.140 |
| Daily | 0.230–0.250 | 0.140–0.230 | 0.110–0.140 |
| Weekly | 0.250–0.300 | 0.120–0.250 | 0.080–0.120 |
| Monthly | 0.300–0.450+ | 0.080–0.300 | 0.040–0.080 |
These bands show probability-weighted price ranges, not guaranteed outcomes.
⚠️ Disclaimer (Education Only)
This content is educational and informational only and does not constitute financial, investment, trading, tax, or professional advice. Cryptocurrency markets are volatile and carry substantial risk; always conduct your own research and consult qualified professionals before making trading decisions.
📣 Please Follow & Support One Web One Hub — Your Crypto Probability Hub
16 Feb 2026 FARTCOINUSDT FI
At One Web One Hub, we publish daily probability-based crypto market analysis using real live price data, multi-timeframe structural interpretation, Renko trend filtering, VWAP bias estimation, demand/supply zone mapping, and sentiment analysis — all designed to help you understand volatile price behavior with clarity.
Bookmark our blog, share insights with your community, and return daily for analytical content that goes beyond hype and equips you with probability-based approaches.
One Web One Hub — your hub for crypto clarity in chaotic markets.
Previous Post FARTCOINUSDT – Probability Analysis for February 10, 2026
Next Post FARTCOINUSDT – Probability Analysis for February 22, 2026


