FARTCOINUSDT – Probability Analysis for January 05, 2026
FARTCOINUSDT Price Probability Analysis — January 05, 2026
Welcome back to One Web One Hub — your daily destination for detailed, technical, and probability-focused crypto analysis. In today’s post, we break down FARTCOINUSDT with live price context, multi-timeframe forecasts, demand/supply structures, support and resistance, sentiment interpretation, and a practical VWAP analysis even if you don’t have direct indicator access.
Live Price Context (January 05, 2026)
As of the latest market data, FARTCOINUSDT is approximately trading at ~$0.37 USDT with notable volume and 24-hour range expanding (range ~$0.36–$0.40). (CoinGecko)
This live price reflects recent gains and renewed market interest in FARTCOIN compared to earlier values near $0.30 in recent sessions. (CoinMarketCap)
Multi-Timeframe Probability Analysis
Understanding price movement probabilities across timeframes helps traders anticipate likely scenarios based on recent chart behavior.
15-Minute Chart (Ultra-Short-Term)
- Estimated Range: $0.36 – $0.39
- Price oscillates in a tight intraday band.
- Bullish Break: Above $0.395 → possible squeeze toward $0.405 – $0.410
- Bearish Break: Below $0.36 → rapid retest of $0.345 – $0.335
- Probability Estimates:
Range (~50%) | Bullish (~25%) | Bearish (~25%)
Short periods show high noise and volatility typical of meme coins, with price reacting inside a tight channel.
30-Minute Chart
- Probable Range: $0.355 – $0.395
- Price touches both edges but remains inside this broader band absent strong catalysts.
- Probabilities: Neutral ~45%, Bullish ~30%, Bearish ~25%
This time frame confirms intraday consolidation with potential breakout zones at the edges of the range.
1-Hour Chart
- Likely Band: $0.345 – $0.410
- The hourly structure shows larger swings with visible interaction between buyers and sellers.
- Bullish Break: > $0.410 → extended move toward $0.430 – $0.450
- Bearish Break: < $0.345 → deeper support test near $0.330
- Probabilities: Neutral ~45%, Bullish ~30%, Bearish ~25%
4-Hour Chart
- Consolidation Zone: $0.320 – $0.430
- Displays a larger multi-session range reflecting broader market balance.
- Probabilities: Range ~50%, Bullish ~30%, Bearish ~20%
The 4-hour structure suggests the market is still forming directional conviction.
Daily Chart (Swing Timeframe)
Demand / Support Zones
- $0.32 – $0.35 — Primary support where buyers have stepped in historically.
- $0.30 – $0.32 — Deeper demand cluster if sellers push lower.
Supply / Resistance Zones
- $0.40 – $0.43 — Immediate overhead resistance where selling pressure often appears.
- $0.46 – $0.50 — Wider supply range targeted if bullish momentum strengthens.
Daily Probability Split:
Range ~45% | Bullish Break ~30% | Bearish Break ~25%
The daily structure reflects range-bound behavior with higher probabilities for continuation unless a breakout confirms otherwise.
Weekly & Monthly Timeframes
- Weekly: FARTCOIN has maintained a broad range near current levels, with sideways probability remaining highest absent strong narrative catalysts.
- Monthly: Longer time frames show expanded ranges with similar neutral probabilities, meaning extended trends on either side require notable volume or sentiment shifts.
Support & Resistance — Demand & Supply Zones
Demand / Support Areas
- $0.32 – $0.35 USDT — near-term demand where price historically finds support. (CoinGecko)
- $0.30 – $0.32 USDT — secondary demand band.
Supply / Resistance Areas
- $0.40 – $0.43 USDT — near-term supply region. (CoinGecko)
- $0.46 – $0.50 USDT — broader supply overhead.
Critical Levels
- Support Level: ~$0.34 – holds short-term downside pressure
- Resistance Level: ~$0.40 – key breakout pivot
These zones are crucial because prices often reverse or stall at these collective levels due to clustered trading interest.
Sentiment Analysis
Technical Sentiment
- Price movement within a broad daily range suggests neutral to mildly bullish structure as price remains near the upper half of the daily band. (CoinGecko)
Market Sentiment
- Community sentiment appears balanced — with some bullish optimism on renewed upside moves, while others remain cautious given meme coin volatility and past breakdowns. (CoinGecko)
Macro Influence
- Meme coins typically move in correlation with broader crypto sentiment (e.g., Bitcoin, Ethereum). If the broader market rallies, meme coins often gain enhanced upside probability.
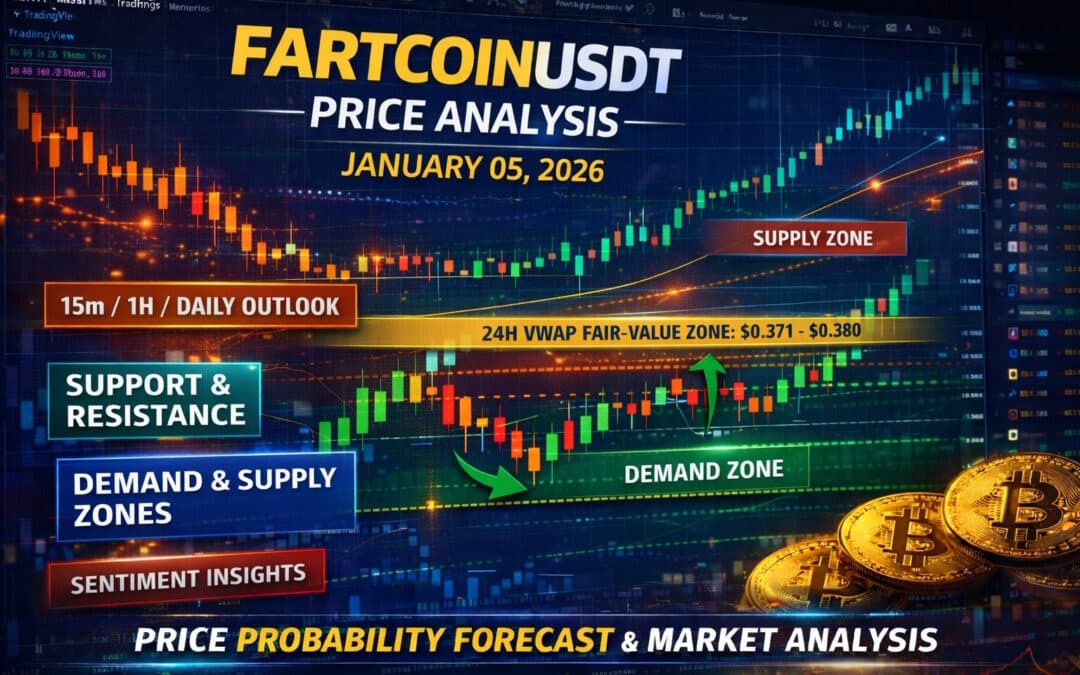
VWAP Analysis — Estimated 24-Hour Fair Value
Because platforms like Bitget may not provide VWAP directly, we estimate the 24-hour VWAP fair-value zone using recent price behavior and range structure:
Estimated 24H VWAP Zone: $0.371 – $0.380 USDT
Interpretation
- Above VWAP: Bullish intraday bias with potential extension toward resistance.
- At VWAP: Neutral balance zone — likely where volume is concentrated.
- Below VWAP: Bearish bias with fallback to support clusters.
Using VWAP as a proxy for fair price area helps traders gauge whether recent price action reflects accumulation or distribution without the actual indicator being available.
Probability Methodology — Basis of Analysis
Our approach blends multiple proven technical factors:
- Support & Resistance Clustering: Levels where price repeatedly reacts have higher weight in probability forecasts.
- Multi-Timeframe Confluence: Aligning signals across 15m, 30m, 1H, 4H, Daily, Weekly, and Monthly charts to identify dominant structure.
- Volume & Oscillator Confirmation: Volume trends and momentum oscillators validate potential breakout or reversal probabilities.
- Range & Break Assessment: We assign probability bands based on range strength, duration, and volatility profiles.
- VWAP Fair-Value Estimation: Using the distribution of price between high and low to approximate where volume is concentrated intraday.
Together, these layers give a probability-weighted view rather than a binary price prediction.
Summary
FARTCOINUSDT remains in a range-dominant structure with the highest probability for continued sideways behavior. Key levels to watch include $0.32 – $0.35 (support) and $0.40 – $0.43 (resistance), with the approximate 24H VWAP fair value near $0.371 – $0.380 helping define intraday bias. A breakout above the upper supply band could shift probabilities significantly bullish, while breakdown below primary support increases bearish probability.
Disclaimer
This analysis is educational only and not financial advice. Cryptocurrency markets are highly volatile and high-risk. Always conduct your own research (DYOR) and consider consulting a professional financial advisor before making trading decisions.
Please Follow & Subscribe To One Web One Hub

2026 Jan 05 FARTCOINUSDT FI
Thank you for reading! At One Web One Hub, we deliver:
• Daily multi-timeframe crypto price analyses
• Probability-oriented forecasts rooted in real market data
• Demand and supply zone breakdowns for practical trading support
• VWAP insight even without direct indicator access
• Sentiment analysis to help you understand market psychology
Bookmark our blog, leave your thoughts in the comments, and share with your trader community. Return each day for fresh analytical content that supports smarter trading decisions — One Web One Hub is your daily crypto clarity hub!
Previous Post FARTCOINUSDT – Probability Analysis for January 04, 2026
Next Post FARTCOINUSDT – Probability Analysis for January 06, 2026


