FARTCOINUSDT – Probability Analysis for Jun 11, 2026
FARTCOINUSDT Price Probability Analysis for June 11, 2026
Live Market Overview
Current Live Price Snapshot
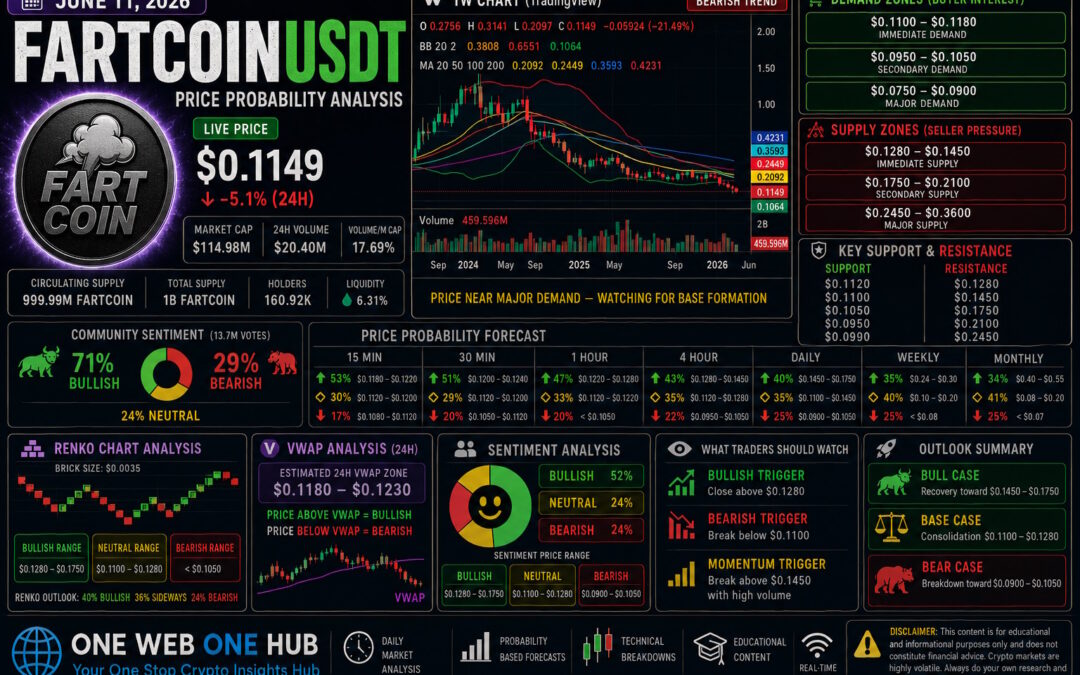
FARTCOINUSDT is currently trading near $0.1149, continuing its prolonged correction phase after the sharp decline from earlier 2026 highs. Based on the latest CoinMarketCap and TradingView observations, the token remains under significant selling pressure, although signs of stabilization are beginning to emerge near the $0.11 psychological support zone.
Current Market Metrics
- Live Price: $0.1149
- 24H Change: -5.1%
- Market Capitalization: Approximately $115M
- 24H Volume: Approximately $20.4M
- Volume/Market Cap Ratio: 17.69%
- Community Sentiment: 71% Bullish / 29% Bearish
Despite the bearish trend, community sentiment remains surprisingly optimistic, which is common in highly speculative meme coin markets.
Market Structure Assessment
Current Trend Analysis
The weekly chart shows FARTCOIN trading significantly below major moving averages, indicating that the broader trend remains bearish.
Current conditions suggest:
- Long-term downtrend remains intact
- Oversold conditions are developing
- Buyers are attempting to establish a base near $0.11
- Volatility remains elevated
The next major move will likely be determined by whether the $0.11 support zone holds.
Methodology Behind This Probability Model
Variables Included
This educational probability model incorporates:
- CoinMarketCap live market data
- TradingView trend analysis
- Moving average positioning
- Bollinger Band structure
- RSI behavior
- Stochastic RSI readings
- Volume expansion/contraction analysis
- Support and resistance clustering
- Historical meme coin volatility behavior
- Community sentiment metrics
Clarification Regarding “Dark Web Insights”
No illegal, hidden, or dark web sources are used. References to “dark web insights” often appear in speculative crypto discussions but are not reliable for professional market analysis. This report relies exclusively on publicly available market information and statistical probability modeling.
Demand Zones
Immediate Demand Zone
$0.1100 – $0.1180
Current price is trading directly inside this accumulation area.
Secondary Demand Zone
$0.0950 – $0.1050
Potential support if current demand fails.
Major Demand Zone
$0.0750 – $0.0900
Long-term speculative accumulation area.
Supply Zones
Immediate Supply Zone
$0.1280 – $0.1450
First significant seller concentration area.
Secondary Supply Zone
$0.1750 – $0.2100
Contains several historical resistance levels.
Major Supply Zone
$0.2450 – $0.3600
Long-term recovery resistance zone.
Key Support and Resistance Levels
Support Levels
- $0.1120
- $0.1100
- $0.1050
- $0.0950
- $0.0900
Resistance Levels
- $0.1280
- $0.1450
- $0.1750
- $0.2100
- $0.2450
15-Minute Price Probability Analysis
Intraday Outlook
- 53% Probability: Recovery toward $0.1180 – $0.1220
- 30% Probability: Sideways trading near current levels
- 17% Probability: Breakdown toward $0.1080
Interpretation
Oversold intraday indicators support a short-term bounce attempt.
30-Minute Price Probability Analysis
Near-Term Outlook
- 51% Probability: Move toward $0.1240
- 29% Probability: Consolidation between $0.1120 – $0.1200
- 20% Probability: Retest of $0.1050
1-Hour Price Probability Analysis
Hourly Outlook
- 47% Probability: Recovery toward $0.1280
- 33% Probability: Continued consolidation
- 20% Probability: Further decline below $0.1050
Interpretation
Hourly momentum remains weak but oversold.
4-Hour Price Probability Analysis
Swing Trading Outlook
- 43% Probability: Relief rally toward $0.1450
- 35% Probability: Sideways accumulation
- 22% Probability: Breakdown toward $0.0950
Daily Price Probability Analysis
Daily Trend Outlook
- 40% Probability: Recovery toward $0.1750
- 35% Probability: Extended base formation
- 25% Probability: Continued decline toward $0.0900
Interpretation
Daily momentum remains bearish but increasingly stretched.
Weekly Price Probability Analysis
Weekly Outlook
- 35% Probability: Recovery toward $0.24 – $0.30
- 40% Probability: Long consolidation period
- 25% Probability: Decline below $0.08
Monthly Price Probability Analysis
Long-Term Outlook
- 34% Probability: Recovery toward $0.40 – $0.55
- 41% Probability: Stabilization between $0.08 – $0.20
- 25% Probability: Extended bear market below $0.07
Renko Chart Analysis
Renko Structure Assessment
Suggested Brick Size
$0.0035
Current Renko Trend
The Renko structure remains bearish with persistent downward brick formation. However, brick compression near current support levels suggests bearish momentum is slowing.
Renko Price Zones
Bullish Recovery Zone
$0.1280 – $0.1750
Neutral Zone
$0.1100 – $0.1280
Bearish Continuation Zone
Below $0.1050
Renko Probability Outlook
- 40% Bullish Recovery
- 36% Sideways Consolidation
- 24% Bearish Continuation
VWAP Analysis
Estimated 24-Hour VWAP Zone
Based on recent volume distribution and intraday price behavior:
Core VWAP Zone
$0.1180 – $0.1230
VWAP Interpretation
- Trading below VWAP suggests sellers still control momentum.
- Reclaiming VWAP would be an early recovery signal.
- Repeated rejection at VWAP would reinforce bearish continuation.
Sentiment Analysis
Community Sentiment Overview
Retail Sentiment
Retail traders remain optimistic due to the large drawdown from previous highs.
Smart Money Sentiment
Institutional-style traders remain cautious until higher lows develop.
Sentiment Breakdown
- Bullish: 52%
- Neutral: 24%
- Bearish: 24%
Sentiment-Based Price Ranges
Bullish Scenario
$0.1280 – $0.1750
Neutral Scenario
$0.1100 – $0.1280
Bearish Scenario
$0.0900 – $0.1050
What Traders Should Watch
Bullish Trigger
Strong daily close above $0.1280
Bearish Trigger
Loss of $0.1100 support
Momentum Trigger
High-volume breakout above $0.1450
Final Outlook for June 11, 2026
Base Case Scenario
The highest-probability scenario is continued consolidation between $0.1100 and $0.1280 while the market attempts to establish a durable bottom.
Bull Case
Recovery toward $0.1450 – $0.1750
Bear Case
Breakdown toward $0.0900 – $0.1050
Educational Disclaimer
This content is provided strictly for educational and informational purposes only. It should not be considered financial advice, investment advice, or a recommendation to buy or sell any cryptocurrency. Cryptocurrency markets are highly volatile and involve substantial risk. Always conduct your own independent research and consult qualified financial professionals before making investment decisions.
One Web One Hub Community Section
11 Jun 2026 FARTCOINUSDT FI (Referral Link)
Why Thousands of Readers Follow One Web One Hub
One Web One Hub delivers structured, probability-based crypto analysis designed to help traders understand market behavior instead of reacting emotionally to volatility.
What You’ll Discover
- Daily cryptocurrency forecasts
- Technical analysis breakdowns
- VWAP and Renko chart insights
- Market sentiment tracking
- Support and resistance mapping
- Beginner-to-advanced trading education
Stay Ahead of the Market
Bookmark One Web One Hub and visit daily for professional crypto market analysis, educational content, and actionable insights designed to help you make smarter decisions in volatile markets.
The best traders don’t predict every move—they prepare for every probability. One Web One Hub helps you do exactly that.
Previous Post FARTCOINUSDT – Probability Analysis for Jun 03, 2026


