ATOMUSDT – Probability Analysis for Jun 09, 2026
ATOM/USDT Price Analysis – June 09, 2026
Current Market Overview of Cosmos (ATOM)
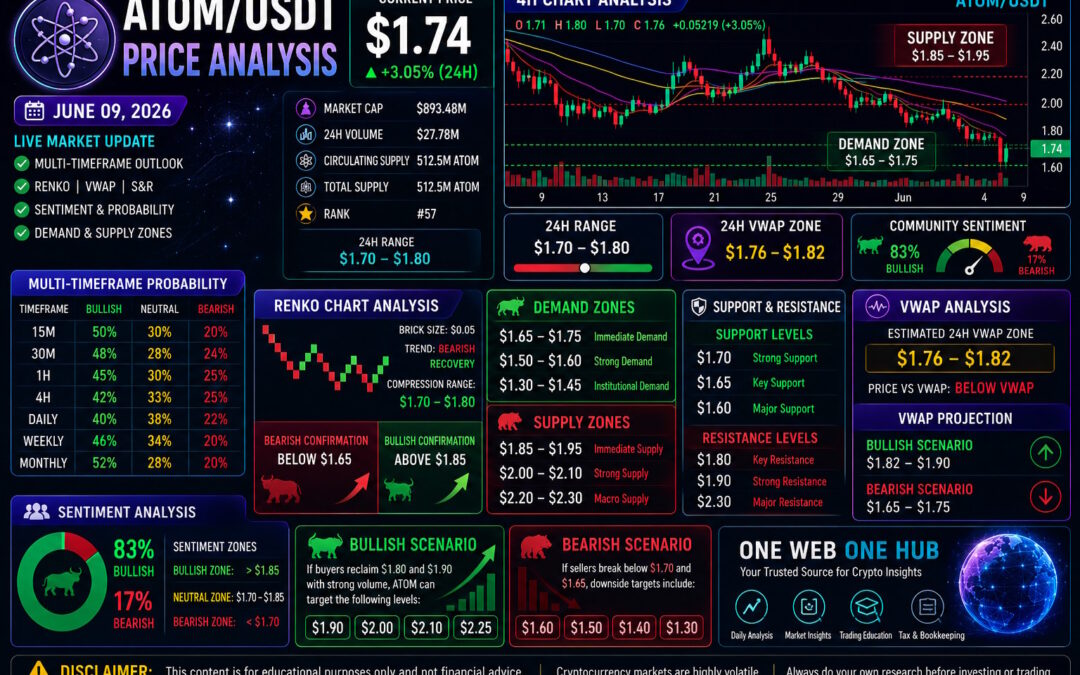
ATOM/USDT is currently trading around $1.74–$1.76, showing a modest recovery after recently touching the $1.59–$1.60 support region. The chart structure indicates that buyers are attempting to defend a critical demand zone after a sharp correction from the $2.20 area.
Recent market behavior observed from TradingView and CoinMarketCap suggests that ATOM remains in a recovery attempt, although the broader trend remains bearish until major resistance levels are reclaimed.
ATOM/USDT Live Market Snapshot
Current Price Metrics
- Current Price: ~$1.74
- 24H Change: +3.05% intraday recovery
- Market Capitalization: ~$893M
- 24H Volume: ~$27.8M
- Market Structure: Recovery Attempt Within Bearish Trend
Intraday Trading Range
- Intraday Low: $1.70
- Intraday High: $1.80
- Active Trading Zone: $1.70 – $1.80
Multi-Timeframe Price Probability Analysis
15-Minute Timeframe Analysis
Market Structure
Short-term rebound remains active following oversold conditions.
Probability Outlook
- Bullish continuation toward $1.80 → 50%
- Sideways consolidation → 30%
- Bearish rejection → 20%
Expected Price Range
- $1.72 – $1.80
Key Observation
Momentum traders are attempting to capitalize on the recent bounce from support.
30-Minute Timeframe Analysis
Market Structure
Recovery channel beginning to form.
Probability Outlook
- Bullish move toward $1.84 → 48%
- Sideways movement → 28%
- Renewed selling pressure → 24%
Expected Price Range
- $1.72 – $1.84
1-Hour Timeframe Analysis
Market Structure
Price remains below major moving averages but has stabilized.
Probability Outlook
- Recovery toward $1.88 → 45%
- Consolidation below resistance → 30%
- Bearish continuation → 25%
Expected Price Range
- $1.70 – $1.88
Key Observation
The hourly structure improves significantly above $1.80.
4-Hour Timeframe Analysis
Market Structure
A corrective rebound is developing after a strong bearish impulse.
Probability Outlook
- Rally toward $1.95 → 42%
- Base formation → 33%
- Further decline → 25%
Expected Price Range
- $1.60 – $1.95
Daily Timeframe Analysis
Market Structure
Daily trend remains bearish but oversold conditions are easing.
Probability Outlook
- Extended recovery → 40%
- Sideways accumulation → 38%
- Continued decline → 22%
Expected Price Range
- $1.50 – $2.00
Weekly Timeframe Analysis
Market Structure
ATOM continues trading within a larger accumulation region.
Probability Outlook
- Base-building continuation → 46%
- Macro recovery development → 34%
- Major bearish continuation → 20%
Expected Price Range
- $1.40 – $2.40
Monthly Timeframe Analysis
Market Structure
Long-term accumulation remains possible despite recent weakness.
Probability Outlook
- Long-term accumulation → 52%
- Bullish reversal cycle → 28%
- Capitulation scenario → 20%
Expected Price Range
- $1.00 – $3.80
Renko Chart Analysis
Renko Structure Overview
- Estimated Brick Size: $0.05
- Current Trend: Bearish Recovery
- Compression Range: $1.70 – $1.80
Renko Interpretation
Recent bearish bricks have slowed while the first signs of bullish reversal bricks are appearing near support.
Renko Confirmation Levels
Bullish Confirmation
- Above $1.85
Bearish Confirmation
- Below $1.65
Renko Price Targets
Bullish Target Zone
- $1.90 – $2.00
Bearish Target Zone
- $1.50 – $1.60
Demand and Supply Zone Analysis
Major Demand Zones
Immediate Demand Zone
- $1.65 – $1.75
Strong Demand Zone
- $1.50 – $1.60
Institutional Demand Zone
- $1.30 – $1.45
These areas historically attract strong buying interest and liquidity absorption.
Major Supply Zones
Immediate Supply Zone
- $1.85 – $1.95
Strong Supply Zone
- $2.00 – $2.10
Macro Supply Zone
- $2.20 – $2.30
These regions have historically produced significant seller activity.
Support and Resistance Levels
Key Support Levels
- $1.70
- $1.65
- $1.60
Key Resistance Levels
- $1.80
- $1.90
- $2.00
VWAP Analysis
Estimated 24H VWAP Zone
Using volume concentration, price distribution, and average trading behavior, the estimated VWAP region is:
- $1.76 – $1.82
VWAP Interpretation
Current price remains slightly below the estimated VWAP zone.
This suggests:
- Buyers are attempting recovery.
- Sellers still maintain broader control.
- Reclaiming VWAP would improve short-term bullish probabilities.
VWAP Projection
Bullish VWAP Recovery
- $1.82 – $1.90
Bearish VWAP Rejection
- $1.65 – $1.75
Sentiment Analysis
Community Sentiment
Current community sentiment remains highly optimistic.
- Bullish Sentiment: 83%
- Bearish Sentiment: 17%
Sentiment Price Zones
Bullish Zone
- Above $1.85
Neutral Zone
- $1.70 – $1.85
Bearish Zone
- Below $1.70
Behavioral Analysis
Despite recent weakness, many market participants continue viewing current levels as long-term accumulation opportunities.
Basis of Probability Analysis
Methodology Used
The probabilities throughout this report are derived from:
- Multi-timeframe trend alignment
- Historical support and resistance reactions
- Volume concentration analysis
- Estimated VWAP positioning
- Renko trend structures
- RSI and Stochastic behavior
- Liquidity sweeps and order-flow concepts
- Market sentiment readings
- Accumulation and distribution patterns
These probabilities represent educational assessments rather than guaranteed outcomes.
Final Outlook for ATOM/USDT
ATOM appears to be attempting a short-term recovery after defending the critical $1.60 demand zone.
Bullish Scenario
If buyers successfully reclaim:
- $1.80
- $1.90
Potential upside targets become:
- $2.00
- $2.10
- $2.25
Bearish Scenario
If sellers regain control below:
- $1.70
- $1.65
Potential downside targets become:
- $1.60
- $1.50
- $1.40
The next major move will likely depend on whether buyers can reclaim the 24H VWAP zone and sustain volume above recent recovery levels.
Educational Disclaimer
This content is strictly for educational and informational purposes only and should not be considered financial advice, investment advice, or trading recommendations. Cryptocurrency markets are highly volatile and involve substantial risk. Always conduct your own research and consult a qualified financial professional before making investment decisions.
Explore More with One Web One Hub
09 Jun 2026 ATOMUSDT FI (Referral Link)
Your Daily Source for Crypto Intelligence
One Web One Hub delivers educational market insights designed for traders, investors, finance professionals, and cryptocurrency enthusiasts.
What You’ll Find
- Daily Cryptocurrency Analysis
- Renko Chart Education
- VWAP Trading Insights
- Market Sentiment Tracking
- Multi-Timeframe Forecasts
- Tax and Bookkeeping Resources
- Financial Education Content
Why Readers Keep Returning
Our content focuses on helping readers understand market behavior rather than simply predicting price movements. Every article combines technical analysis, risk management concepts, market psychology, and educational insights to help you make more informed decisions.
Bookmark One Web One Hub today and stay connected to a growing library of cryptocurrency analysis, financial education, and market intelligence.
Previous Post ATOMUSDT – Probability Analysis for Jun 04, 2026


