XRPUSDT – Probability Analysis for May 24, 2026
XRPUSDT Price Analysis – May 24, 2026
Live Market Overview
According to the latest XRPUSDT market data from TradingView and CoinMarketCap:
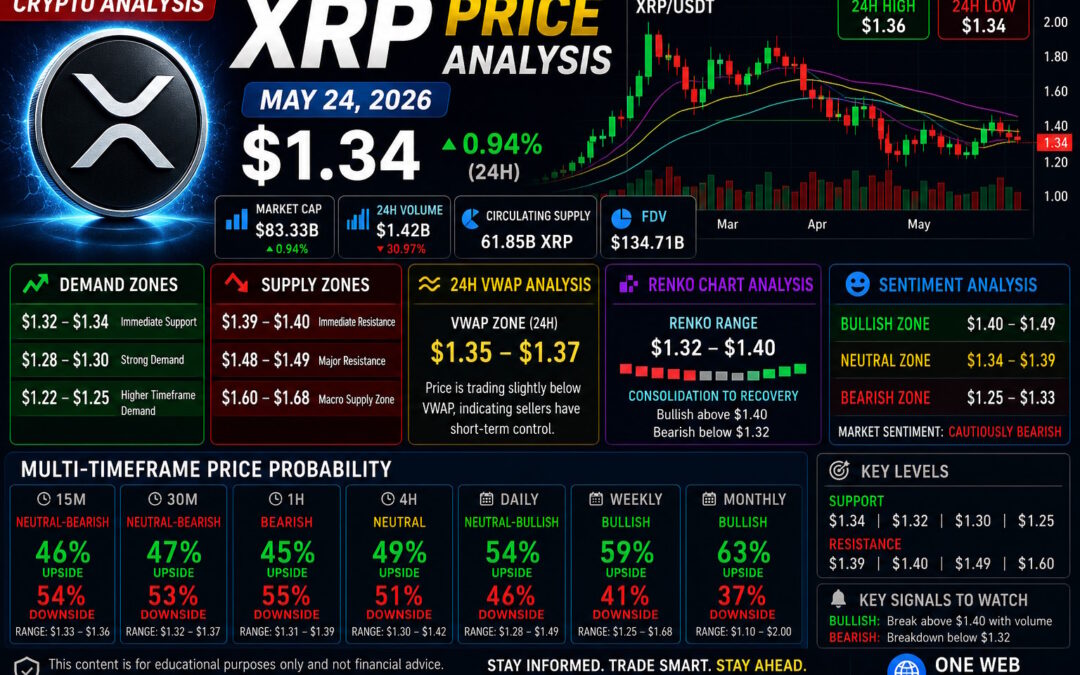
- Current XRP Price: $1.34
- 24H Change: +0.94%
- Intraday High: $1.36
- Intraday Low: $1.34
- Market Cap: ~$83.33B
- 24H Volume: ~$1.42B
- RSI: 41.46
- Stochastic RSI: 10.64 / 8.40
- Bollinger Band Range: $1.32 – $1.49
XRP is currently trading under mild bearish pressure after failing to maintain upside momentum above the $1.40 region. However, oversold momentum indicators suggest a potential short-term recovery attempt.
Current Market Structure
Short-Term Trend
- XRP rejected from the $1.39–$1.40 resistance region.
- Price is consolidating near lower Bollinger Band support.
- Momentum indicators are approaching oversold territory.
Current short-term structure remains neutral-bearish.
Higher Timeframe Context
- XRP continues holding above major support at $1.32.
- Macro trend remains constructive despite recent weakness.
- Market is currently in a compression phase.
Higher timeframe structure remains neutral with long-term bullish potential.
Demand and Supply Zones
Major Demand Zones
$1.32 – $1.34
Immediate support and buyer reaction zone.
$1.28 – $1.30
Strong short-term accumulation area.
$1.22 – $1.25
Higher timeframe demand zone.
Major Supply Zones
$1.39 – $1.40
Immediate resistance cluster.
$1.48 – $1.49
Major breakout resistance.
$1.60 – $1.68
Macro supply zone.
Support and Resistance Levels
Key Support Levels
- $1.34
- $1.32
- $1.30
- $1.25
Key Resistance Levels
- $1.39
- $1.40
- $1.49
- $1.60
A sustained recovery above $1.40 may shift momentum back toward bullish continuation.
24-Hour VWAP Analysis
Estimated 24H VWAP Zone
$1.35 – $1.37
VWAP Interpretation
- Price above VWAP = bullish intraday strength
- Price below VWAP = bearish intraday control
- Price near VWAP = equilibrium consolidation
XRP is currently trading slightly below the estimated VWAP zone, indicating sellers still maintain short-term control.
Renko Chart Analysis
Current Renko Structure
- Consecutive red Renko bricks indicate bearish momentum.
- Brick compression suggests slowing downside pressure.
- Buyers attempting to stabilize near support.
Renko Price Range
$1.32 – $1.40
Key Renko Signals
Bullish reversal confirmation:
Above $1.40
Bearish continuation confirmation:
Below $1.32
Renko structure currently supports a consolidation-to-recovery scenario if support holds.
Multi-Timeframe Price Probability Analysis
The following probabilities are derived from:
- Market structure
- Momentum indicators
- VWAP positioning
- Volume profile
- Renko direction
- Historical reaction zones
15-Minute Timeframe
Bias: Neutral-Bearish
- Upside Probability: 46%
- Downside Probability: 54%
Expected Range: $1.33 – $1.36
30-Minute Timeframe
Bias: Neutral-Bearish
- Upside Probability: 47%
- Downside Probability: 53%
Expected Range: $1.32 – $1.37
1-Hour Timeframe
Bias: Bearish
- Upside Probability: 45%
- Downside Probability: 55%
Expected Range: $1.31 – $1.39
4-Hour Timeframe
Bias: Neutral
- Upside Probability: 49%
- Downside Probability: 51%
Expected Range: $1.30 – $1.42
Daily Timeframe
Bias: Neutral-Bullish
- Upside Probability: 54%
- Downside Probability: 46%
Expected Range: $1.28 – $1.49
Weekly Timeframe
Bias: Bullish
- Upside Probability: 59%
- Downside Probability: 41%
Expected Range: $1.25 – $1.68
Monthly Timeframe
Bias: Bullish
- Upside Probability: 63%
- Downside Probability: 37%
Expected Range: $1.10 – $2.00
Sentiment Analysis
Current Market Sentiment
Current XRP sentiment is cautiously bearish in the short term because:
- Price trades below short-term resistance.
- VWAP positioning favors sellers.
- Momentum indicators remain weak.
- Volume remains moderate.
However, oversold conditions may support a temporary recovery bounce.
Sentiment Price Ranges
Bullish Sentiment Zone:
$1.40 – $1.49
Neutral Sentiment Zone:
$1.34 – $1.39
Bearish Sentiment Zone:
$1.25 – $1.33
Market sentiment remains highly dependent on whether XRP can reclaim the VWAP and resistance cluster.
Basis of Probability Calculations
This analysis framework combines multiple technical tools and market behavior indicators:
Price Action Analysis
Trend continuation, rejection, and breakout behavior.
Momentum Indicators
RSI and Stochastic RSI positioning.
VWAP Positioning
Estimated institutional intraday control zones.
Volume Profile
Liquidity concentration and market participation.
Renko Structure
Noise-filtered directional confirmation.
Historical Market Reactions
Repeated responses around key price zones.
These models generate probability scenarios rather than guaranteed outcomes.
Key Signals Traders Should Watch
Bullish Signals
- Strong reclaim above $1.40
- Sustained trading above VWAP
- Increasing buying volume
- RSI recovery above 50
Bearish Signals
- Breakdown below $1.32
- Weak bounce attempts
- Continued rejection near $1.39–$1.40
Continue Learning With One Web One Hub
24 May 2026 XRPUSDT FI (Referral Link)
At One Web One Hub, we focus on helping traders understand cryptocurrency markets with clear, educational, and structured analysis.
Readers benefit from:
- Daily XRP technical analysis
- Multi-timeframe market insights
- Smart money trading concepts
- Crypto trading education
- Beginner-friendly explanations
- Market psychology breakdowns
Our mission is to help traders improve decision-making through deeper market understanding and disciplined analysis.
Stay connected with One Web One Hub for more professional crypto market insights and educational content.
Educational Disclaimer
This content is for educational and informational purposes only and does not constitute financial advice.
Cryptocurrency trading involves significant risk and volatility. Always conduct your own research and consult a licensed financial advisor before making investment decisions.
Previous Post XRPUSDT – Probability Analysis for May 17, 2026


